Experiment Objectives
1. Learn Atomic Absorption Spectrophotometer(AAS) analysis method principle and operation, learn atomic absorption spectrophotometer’s structure.
2. Learn magnesium analysis method by atomic absorption spectrophotometer. Learn the data process method by computer.
Principle
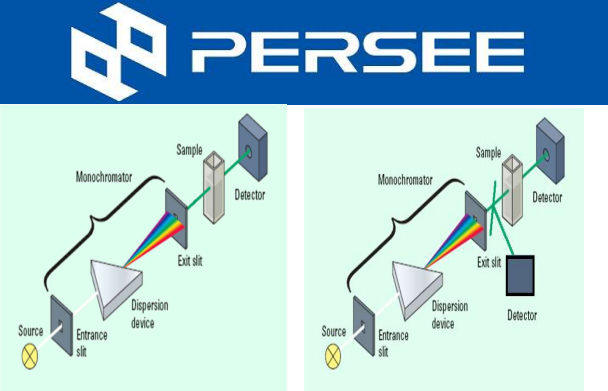
A light with certain intensity at a certain wavelength is emitted from the hollow cathode lamp of the AA. When it passes through a flame containing the vapor of the ground state atoms of the measured element, some of the characteristic lines of light are absorbed, while the unabsorbed light goes through monochromator, which is detected by photodetector. According to the absorption intensity of the light characteristic line, the content of the element to be measured in the sample.
Quantitative analysis: Element’s absorbance at specific wavelength increases in direct proportion to concentration and optical distance through flame. According with Lambert-Beer’s Law:
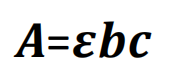
A= absorbance
![]() = absorbance factor
= absorbance factor
b= optical distance
c= concentration
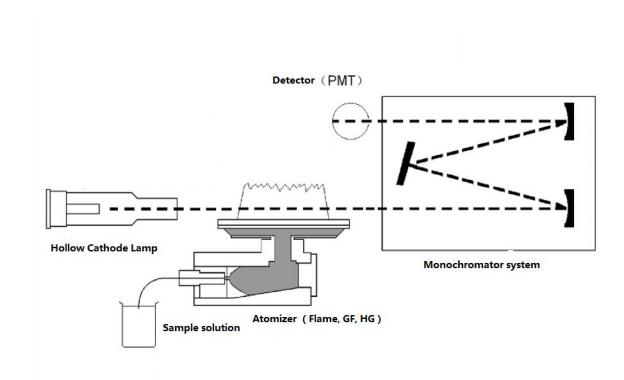
Fig.1 AAS Structure
Features: Low detection limit, reliable result, high selectivity and widely application fields, more than 70 elements can be tested.
Shortages: Difficult to determine refractory and non-metallic elements, not simultaneous multi-element determination.
Hollow Cathode Lamp (HCL)
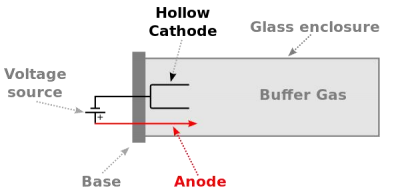
Fig.2 HCL Structure
A hollow-cathode lamp (HCL) is type of cold cathode lamp used in physics and chemistry as a spectral line source. High sensitivity and selectivity, Different element analysis needs different lamp.
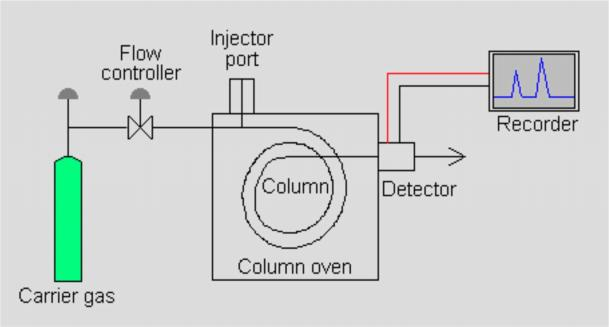
Flame Atomizer System
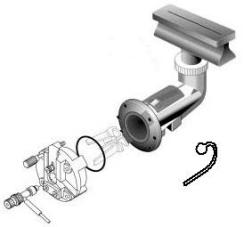
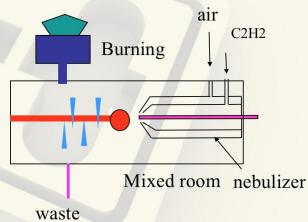
Fig.3 Flame Atomizer
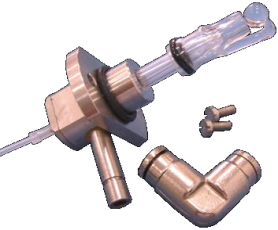
Fig.4 High performance glass nebulizer
Nebulizer: Control the flow rate of sample, the liquid sample is sucked through a capillary tube by a high pressure jet of gas flowing around the tip of the capillary (Bennoulli effect). This is also referred to aspiration. The high velocity breaks the sample into a mist and carries it to the atomization region.
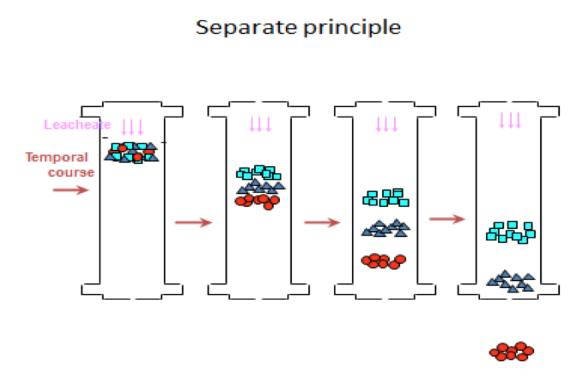
Quantitative analysis method
1. Standard calibration curve method – suitable for samples with simple composition and less interference. Prepare a standard solution containing different concentrations of the test element in the same or similar matrix as the sample solution, and measure the absorbance value to build the calibration curve, then quantitative the unknown sample’s concentration value.
2 Standard addition method- the coexistence of the matrix components in the solution is more complex, that is, in the standard solution by adding the same type and concentration of the matrix components, in order to eliminate or reduce the interference caused by the matrix effect.
Experiment
Reagents
Magnesium standard stock solution: Accurately weigh 3.9173 g AR grade anhydrous MgCl2, dissolve in deionized water and dilute to mark in a 1000-mL volumetric flask at a concentration of 1.0 mg·mL-1 Mg2+. Magnesium standard
working solution: 1 mL of magnesium stock solution was placed in a 100 mL volumetric flask and diluted to the mark with deionized water at a concentration of 10 μg·mL-1 Mg2+. Strontium solution (1%): Weigh 3.04 g of SrCl2 · 6H2O in 100 mL of deionized water.
Method procedures
Standard curve method
1. Selection of the addition amount of interference inhibitors: Pipette 6 aliquots of 5.00 mL of water sample into six 25 mL volumetric flasks and add 1% (mass percent) SrCl2 0.00, 0.50, 1.00, 2.00, 3.00, 4.00 respectively. Dilute to volume with deionized water. Under the selected instrument working conditions, using deionized water as a reference zero, and 5.00 mL water sample as a blank, determine the absorbance of the magnesium solution and make the absorbance – Strontium concentration curve, select the larger and stable absorbance as the addition amount of strontium solution.
2. Determination of linear range: Pipette 0.50, 1.00, 1.50, 2.00, 2.50 mL of 10 μg·mL-1 magnesium standard solution into five 25 mL volumetric flasks, add the selected amount of strontium solution, and dilute to the mark with deionized water. Under the working conditions of the instrument, using the selected solution of strontium solution and diluting to 25.00 mL of solution with deionized water as the blank, measure the absorbance of different concentrations of the standard solution, and make a standard curve of
absorbance-magnesium solution on the computer to calculate the regression equation, and determine the linear range of magnesium determinations under the selected conditions.
3. Aspirate 5.00 mL of water sample and place in two 25 mL volumetric flasks. Add the strontium solution and dilute to the mark with deionized water. Determination of magnesium content as above method.
Standard addition method
In five 25 mL volumetric flasks, add 3.00 mL water samples (depending on the magnesium level, add appropriate amount of sample solution in the range of 1.0 to 5.0 mL) and the selected amount of strontium solution, and then add 10 μg·mL each -1 Magnesium standard solution 0.0, 0.50, 1.00, 1.50, 2.00mL, diluted to volume with deionized water. Under the working conditions of the instrument, the blank solution (the selected hydrazine solution was diluted to 25 mL with deionized water) was used as the reference zero, and the absorbance was measured.
Instrument operation method and test parameters
Instrument operation method
1. Switch on the regulator and power on computer; power on the instrument, start up AAWIN software on the desktop of the computer, click “Online” to initialize the instrument.
2. Power on the ventilation device.
3. Power on the air compressor; adjust the pressure in the range of 0.25MPa- 0.30MPa.
4. Turn on the acetylene cylinder; adjust the output pressure in the range of 0.08-.010MP
5. After initialization finishing, select the work lamp and warm up lamp (make sure the elements you set by the software are the same as the actual elements), click Next step and Search peak.
6. After searching peak, close this interface, and click Next step and Finish to enter into the main interface.
7. Make sure the central axis of the element lamp light path is right located above the burner slit, if not adjust the Flame height and position of Burner parameter settings.
8. Set up the sample parameter.
9. Set up the measurement parameter.
10. Ignition.
11. Measurement.
12. Display the Relativity of calibration curve.
13. Print and save the result.
14. Turn off the acetylene cylinder.
15. Power off the air compressor and release water.
16. Power off the ventilation device.
17. Power off the instrument and computer
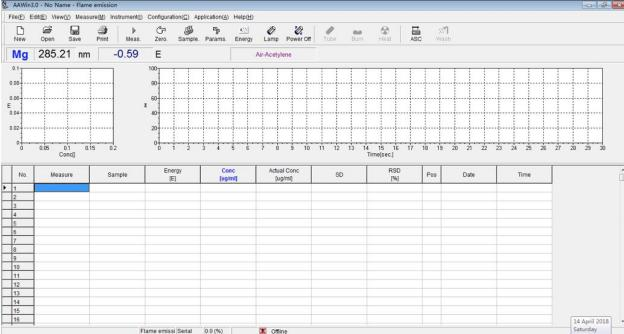
Fig.5 AAWin interface