Experiment Objectives
1. Learn UV-VIS Spectrophotometer analysis method principle and operation, learn UV-VIS spectrophotometer’s structure.
2. Learn food preservative analysis method by UV-VIS Spectrophotometer.
3. Learn the data process method by computer, learn how to quantify preservative in food.
Principle
1. Qualitative analysis: Different wavelength has different absorbance for sample, according to absorbance peak, absorbance valley, shoulder peak, and absorbance of sample to do qualitative analysis.
2. Quantitative analysis: Compound’s absorbance at specific wavelength increases in direct proportion to concentration and optical distance through sample
Lambert-Beer’s Law:

3.Quantitativeanalysis principle of UV-VIS Spectrophotometer.
![]()
4. Test conditions
![]()
Absorbance range: 0.2-0.7Abs
Reference solution:
Blank sample: Solvent without sample
Reference cell: same material and type cuvette as sample cell, paired
UV-VIS Spectrophotometer structure
A UV-VIS system consists of light source, monochromator, sample holder, detector and signal system.
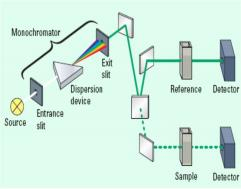
Fig.1 Double beam UV-VIS
Light source: tungsten lamp emits light 320-2500nm, deuterium lamp emits light 185~400 nm
Monochromator: split mixed light into monochromatic light, as shown in Fig.1. Sample holder: to hold the sample and reference, Glass material/plastic material cuvettes for visible WL test, Quartz cuvettes for ultraviolet WL test.
Detector: Receive the light and convert into electrical signal.
According to optical path of UV-VIS system, the UV-VIS divides into three different types: Double beam(Fig. 1), Single beam(Fig.2) and split beam(Fig.3).
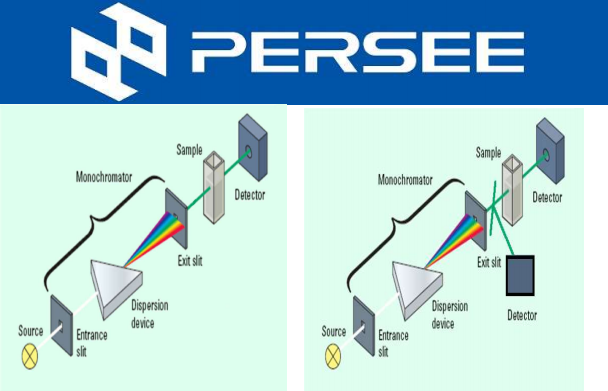 Fig.2 Single Beam Fig.3 Split beam
Single beam, single beam is simplest optical system of UV-VIS, the whole light from monochromator through the sample to detector.
Split beam, the light from monochromator is split in two parts, one beam is through the sample to detector, another beam directly arrives at detector, this beam is reference beam.
Double beam, the light from monochromator is split in two parts, one beam is through the sample to detector, another beam is through the reference sample to detector.
Experiment – Food preservative content analysis in sprite
Benzoic acid and sorbic acid are two common kinds of food preservatives. Benzoic acid has an aromatic structure and has K absorption band and B absorption band at wavelengths of 228nm and 272nm. Sorbic acid has α, β unsaturated carbonyl structure, and there is a K absorption band of π→π* transition at a wavelength of 255nm. Therefore, according to their UV absorption spectrum characteristics can be qualitatively identified and quantitatively determined.
Qualitative analysis of preservative
Take the purified and diluted ether extract (or Sprite diluted aqueous solution), use
a 1cm absorption cuvette, with diethyl ether (or distilled water) as a reference, UV absorbance spectrum at wavelength of 210~310nm, according to the absorption peak wavelength, absorption intensity and Absorbance spectra of benzoic acid and sorbic acid standard samples were compared to determine the type of preservative in the sample.
Standard calibration curve
Prepare benzoic acid (or sorbic acid) standard solution accurately weigh 0. 10g standard sample, dissolve with ether (or water), transfer to a 25mL volumetric flask and dilute to volume. Dilute 1mL of this solution with ether (or water) to 25mL. The standard sample contains 0.16 mg mL-1 as a stock solution. Pipette 5mL of stock solution into a 25mL volumetric flask and make up to a standard concentration of 32μg.mL-1 after constant volume.
Pipette standard solutions 0.50 mL, 1.00 mL, 1.50 mL, 2.00 mL and 2.50 mL in five 10 mL volumetric flasks and dilute to volume with ether (or water). The absorbances of the above five standard solutions are measured by using a 1 cm quartz cuvette, with diethyl ether (or water) as a reference and the maximum absorption wavelength of the K absorption band of benzoic acid or sorbic acid as test wavelength.
UV-VIS spectrophotometer and UVWin operation procedures
1. Power on computer and UV-VIS spectrophotometer.
2. Start UVWIN software to initialization.
3. Pre-warm the instrument 20min.
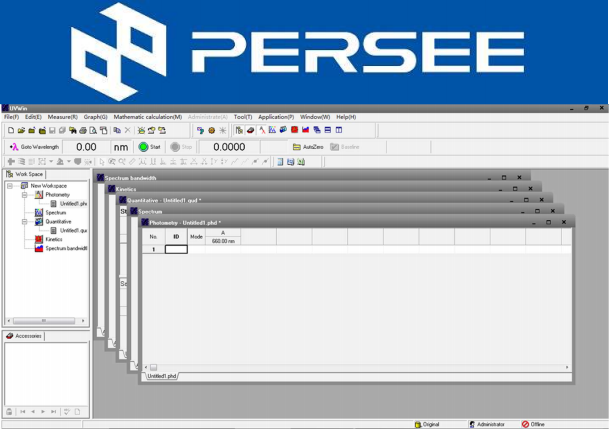
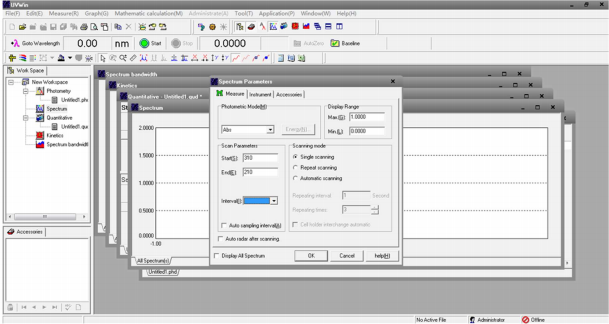
4. After initialization, enter into operation interface, as the following picture shown, the software including five main functions: Photometric measurement, Spectrum scanning, Quantitative analysis, Kinetic scanning and SBW scanning. SBW scanning function active only for T8DCS and T9/T10DCS.
Spectrum scanning
Quantitative analysis
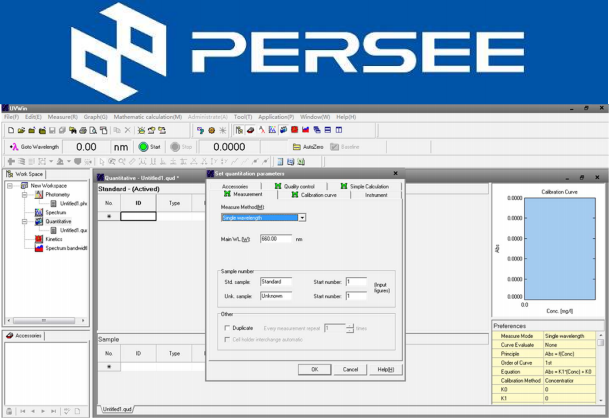
5. Test standard samples to create calibration curve and calculate unknown sample concentration.
6. After test, output data or print test report, then power off instrument and computer.
UV-VIS PRODUCTS FROM PERSEE


