The Beer-Lambert law is central to routine spectrophotometry: under suitable conditions, absorbance tracks concentration and optical path length. That relationship is powerful because it turns a light measurement into a quantitative result. It is not unlimited, though. As concentration rises, a calibration curve can bend, residuals can widen, and the reported absorbance can stop representing concentration in a dependable linear way.
A high result does not automatically mean the compound has changed or the instrument has failed. The first question is whether the deviation comes from the optical system, the sample chemistry, or the way the sample is presented. That distinction matters in UV Vis concentration work because dilution, wavelength selection, cell path length, and bandwidth can often restore a useful working range, while other cases call for a different method.
What High Absorbance Does to the Measurement
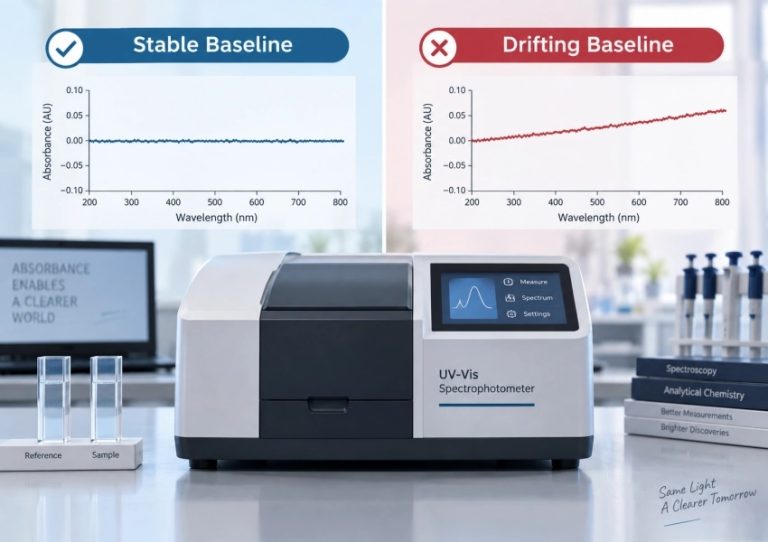
At high absorbance, very little useful light reaches the detector. Stray light, detector limits, source instability, and imperfect wavelength selection then have a larger influence on the apparent signal. The result may flatten rather than continue rising as concentration increases. A curve can look acceptable if only the endpoints are reviewed, so inspect residuals, replicate behavior, and the actual spectrum instead of relying on a single correlation value.
Test Linearity Before Calling It a Chemical Failure
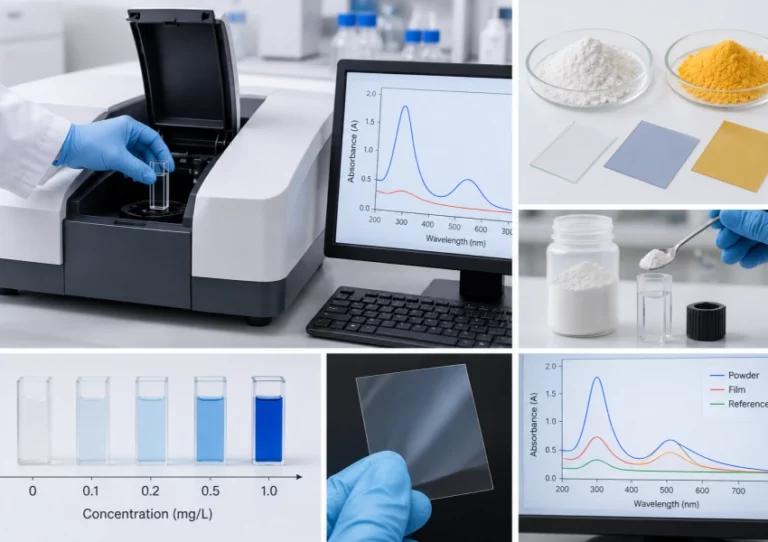
Prepare a concentration series that covers the proposed working range and measure it with the same cell, solvent, wavelength, and bandwidth. Look for a systematic bend, a change in slope, or increasing variation at the upper levels. Then repeat selected levels after dilution. If the diluted result returns to the established relationship, the original range was likely too high for the chosen conditions. If it does not, investigate sample chemistry and preparation as well.
Optical Causes of Beer-Lambert Deviation
The instrument does not need to be defective for the law to appear to fail. Optical conditions that are acceptable for a moderate absorbance can become limiting at the top of a calibration series. High-quality instrument selection reduces that risk, but it does not remove the need to verify the method with real standards.
Stray Light and Photometric Range
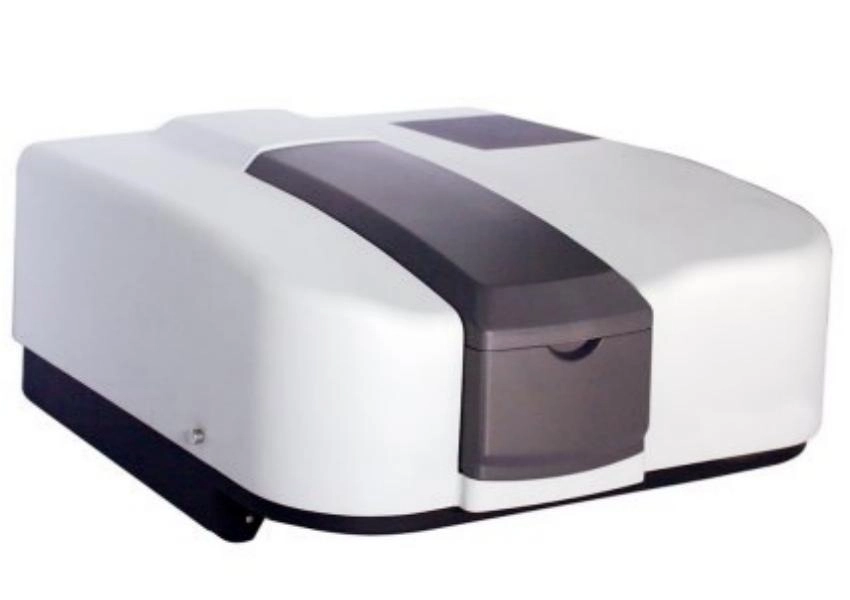
Stray light adds an unintended component to the detected signal. At high absorbance, that extra light can make the sample look less absorbing than it really is and compress the upper part of the curve. The T9DCS is specified with very low stray light of no more than 0.00004%T at 220 nm and a listed photometric range of -8.0 to 8.0 Abs. Those specifications are useful when screening demanding applications, but the laboratory should confirm performance at its own wavelengths and absorbance levels.
The T10DCS carries the same listed optical direction for very low stray light, nitrogen-purged deep-UV operation, continuously selectable bandwidth, and an adjustable beam size. Such features can expand the practical measurement window. They do not turn every concentrated sample into a valid direct reading; sample dilution and method-specific linearity remain important.
Bandwidth and Wavelength Choice
A bandwidth that is too broad can average a narrow absorption feature and change the measured peak. At high concentration, measuring exactly at the strongest peak may also push the signal outside the most useful linear region. It describes choosing a lower-sensitivity wavelength when a concentrated compound needs more room in the calibration curve and choosing bandwidth by checking how absorbance changes as the setting changes. These are practical experiments, not universal settings.
Chemical and Sample Reasons for Nonlinearity
Optics are only one part of the explanation. The Beer-Lambert relationship assumes that the absorbing species and measurement conditions remain suitable as concentration changes. Real samples can break that assumption before the detector reaches a hard limit.
Association, Equilibria, and pH
At higher concentration, molecules may associate, interact with solvent, or shift between chemical forms. A pH-sensitive compound can change its absorbing species as dilution or reagent addition changes the equilibrium. The molar absorptivity then is no longer effectively constant across the series. Check solution preparation, pH, reaction time, solvent composition, and temperature before treating a curved plot as an optical fault.
Turbidity, Particles, and Matrix Effects
Suspended particles scatter light and can raise the apparent absorbance, while a dense matrix may absorb at the selected wavelength or alter the analyte response. The effect can be inconsistent between replicate cells if material settles or bubbles form. Compare a clear, filtered, or appropriately prepared solution with the original sample only when that change is acceptable for the method. Record the preparation change and test recovery; a visually clearer solution is not automatically a chemically equivalent one.
Practical Ways to Restore a Useful Working Range
Once the cause is narrowed down, the correction should be simple enough for routine analysts to perform and document. The goal is not to force every sample into one absorbance window. It is to select conditions that give a defensible response for the intended decision.
Dilute, Shorten the Path, or Lower the Sensitivity
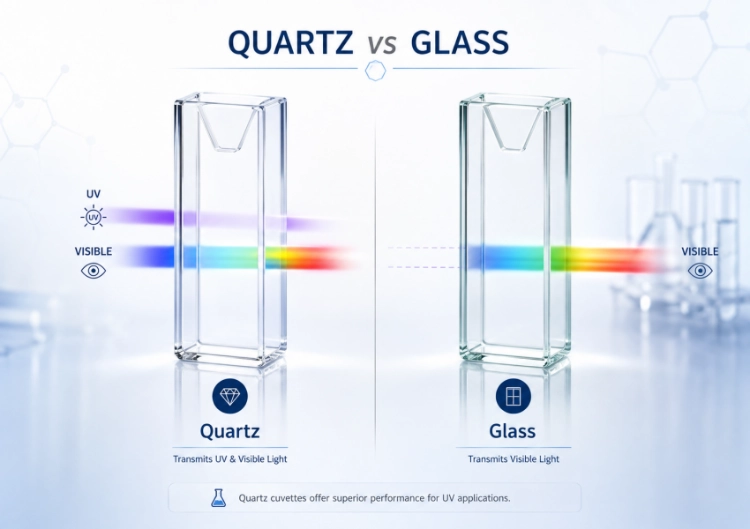
Dilution is often the cleanest correction when the sample remains stable and the preparation step has acceptable recovery. A shorter optical path can also reduce absorbance, provided the holder and calculation are designed for it. Another option is a lower-sensitivity wavelength near the absorption feature. Each change must be reflected in the calibration design and checked for selectivity, precision, and solution stability.
Rebuild the Calibration Instead of Trimming Data
Do not simply delete the highest standards because they bend the curve. Define a working range from evidence, prepare standards across that range, and review residuals rather than only the fitted line. If several ranges are needed, document which range applies to which sample preparation. A method can be linear after dilution and non-linear as a direct measurement; those are different procedures, not contradictory results.
Verify the Instrument Before Buying More Range
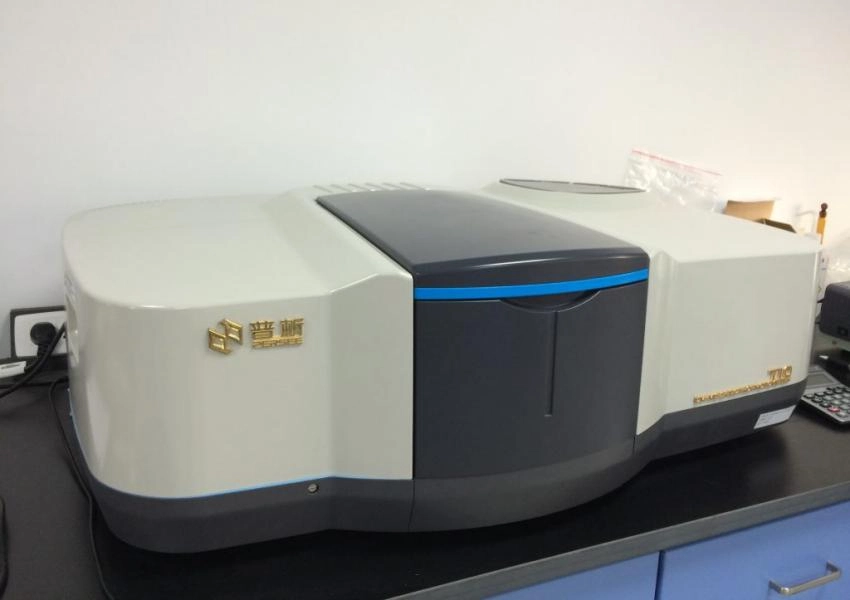
A purchase decision should connect the expected absorbance and wavelength to an instrument’s optical design, accessories, and verification support. The T8DCS offers true double-beam optics, photomultiplier detection, and a continuously selectable 0.1-5 nm spectral bandwidth. It can be a sensible platform when the laboratory needs flexible settings for method development and routine quantitative work.
For applications near the upper end of the photometric range or in the deep UV, the T9DCS or T10DCS deserves a closer technical review. Confirm the claimed performance with suitable standards, check the selected wavelength and bandwidth, and test the actual sample matrix. The UV-Vis IQ/OQ/PQ qualification kit can support a documented qualification discussion, but it does not replace method-specific absorbance linearity studies.
A reliable spectrophotometry method therefore treats Beer-Lambert behavior as something to demonstrate. The useful question is not whether the law fails in the abstract. It is where the response remains linear, why it changes outside that range, and whether the chosen instrument and sample preparation keep the reported result inside a defensible zone. PERSEE can be reviewed against that evidence.
FAQ
Q1: Does high concentration always make the Beer–Lambert law fail?
A1: No. The usable range depends on the analyte, solvent, wavelength, path length, bandwidth, optical system, and sample matrix. High concentration increases the risk of deviation, so linearity should be demonstrated for the actual method.
Q2: Is dilution the only way to correct nonlinearity?
A2: No. A shorter path length, a lower-sensitivity wavelength, narrower or otherwise justified bandwidth, improved sample preparation, or a better-defined calibration range may help. Each change needs verification.
Q3: Which instrument features matter for concentrated UV-Vis samples?
A3: Review stray-light performance, photometric range, wavelength accuracy, bandwidth control, beam size, sample accessories, and qualification support. Representative high-concentration standards should be part of the supplier evaluation.