1. Introduction
Iron in pharmaceutical preparations may be provided in the form of ferrous sulphate, gluconate or ferrate salts. The active ingredients are normally held in a matrix which must be destroyed, before the iron can be accurately determined. In this experiment, the matrix is destroyed by oxidation with concentrated nitric acid. The iron, after conversion to the ferrous state, is complexed with 1:10-phenanthroline and determined by visible spectrophotometry.
2. Experimental procedure
(A) Sample Preparation:
A ground tablet sample will be provided for analysis.
(i) Weigh about 0. 1g of the ground sample into each of three clean, dry boiling tubes.
(ii) Add to each of these tubes, plus one blank tube, 5 mL analytical grade nitric acid. Allow to stand in a fume hood overnight (10-12h) to predigest. (iii) Heat the tubes on a sand bath or hot block at 135-140°C for 2-3h, to complete the extraction procedure.
(iv) Cooling down to room temperature, dilute the contents with 10mL distilled water and mix well. Filter through #1 filter paper into 250mL volumetric flasks and make up to the mark with distilled water washings of the boiling tubes and filter papers.
(v) Pipette out 2 mL of each sample solution into a 100mL volumetric flask. Add 5mL of 10% (w/v) aqueous hydroxylamine hydrochloride solution and 5mL of 1M sodium acetate-acetic acid buffer (pH 5.0). Add 4mL of 0.25% (w/v) aqueous 1, 10-phenanthroline and make up to the mark with distilled water. Allow to stand for one hour before making measurements on these solutions.
(vi) Similarly prepare a series of Fe standards (25mL each) containing 0, 1.0, 2.0, 4.0, 6.0, and 8.0ug Fe/mL respectively, using the standard Fe solution provided.
(B) Visible Spectrophotometry
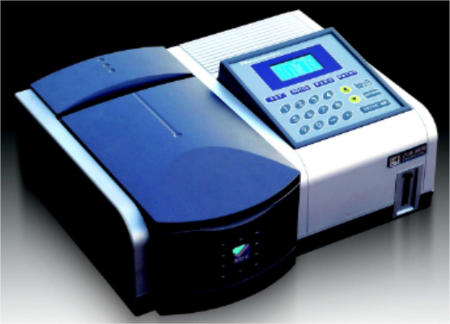
T6U/T6V UV-VIS Spectrophotometer from PERSEE Analytics
(i) Power on and allow spectrometer to warm up and stabilize. (ii) Rinse and fill a clean cuvette with some of the standard blank solution and wipe the external surfaces clean with a soft tissue.
Fill another cuvette with the 1.0ug/mL Fe standard solution.
(iii) Set test parameters (400-700nm), place the blank sample cuvette in
the first sample cell holder. Cover the sample lid to do baseline correction.
(iv) Take out the blank sample, put the 1.0ug/mL Fe standard solution cuvette into the first cell holder, cover the sample lid to start scanning the sample, and locate the wavelength at which maximal absorbance occurs, and the absorbance value at this wavelength.
(v) Measure the absorbance of all the other standards and sample solutions at the chosen wavelength, corrected for their respective blank values.
(C) Calculations:
Plot a calibration curve of Absorbance vs Fe concentration of the iron- phenanthroline complex and determine the Fe concentrations of the sample solutions.
Alternatively, calculate the linear regression equation and correlation coefficient for the calibration curve and hence determine the Fe concentrations of sample solutions.
Hence calculate the mean iron concentration of the sample provided ± standard deviation.
Reference:
(1) Vogel’s Textbook of Quantitative Inorganic Analysis 4th. edition
(1988). Longman’s Publ. 742 – 743.
(2) T3F ANALYTICAL CHEMISTRY EXPERIMENTS, Labscripts compiled and revised by Dr. I Chan Yen and Dr. L Chattergoon