Chọn máy quang phổ phù hợp liên quan đến một đánh giá chi tiết của phòng thí nghiệm của bạn’ nhu cầu kiểm tra. Công việc này có thể có tính chất, nhằm phát hiện các hợp chất hoặc định lượng, đòi hỏi đọc nồng độ chính xác. Hơn nữa, loại mẫu ảnh hưởng đến sự lựa chọn rất nhiều.
Việc tuân thủ các quy tắc và tiêu chuẩn là một khía cạnh quan trọng khác. Rất nhiều phòng thí nghiệm phải tuân thủ các hướng dẫn USP, Ph. Eur. hoặc ASTM. Các hướng dẫn như vậy xác minh công cụ’ s chức năng và hiệu suất thông qua các thử nghiệm hóa học khác nhau. Các thử nghiệm này đánh giá độ chính xác quang học, độ chính xác bước sóng, băng thông và ánh sáng lạc, đảm bảo thiết bị hoạt động đáng tin cậy trong các hoạt động thường xuyên và đáp ứng kỳ vọng của ngành công nghiệp về kiểm soát chất lượng.
Phạm vi bước sóng và sự ổn định nguồn ánh sáng phát hiện tác động như thế nào?
Các đặc điểm hấp thụ của chất phân tích chính của bạn nên định hình sự lựa chọn phạm vi phổ. Do đó, các hệ thống UV-Vis cho thấy sự linh hoạt tuyệt vời, thích ứng tốt với nhiều ứng dụng trong các thiết lập nghiên cứu và công nghiệp nơi các bước sóng đa dạng chứng minh là cần thiết cho kết quả chính xác. Cũng như quan trọng là nguồn ánh sáng’ Sức mạnh và sự ổn định trên phổ làm việc đầy đủ. Đèn deuterium và vonfram là lựa chọn tiêu chuẩn, và các phiên bản được sắp xếp trước làm cho việc xử lý và bảo trì đơn giản hơn.
Đặc điểm máy dò nào quan trọng nhất đối với độ chính xác và độ nhạy cảm?
Máy dò’ Sự phản ứng đóng một vai trò trực tiếp trong việc phát hiện một lượng nhỏ các chất phân tích. Giữ tỷ lệ tín hiệu-tiếng ồn thấp rất quan trọng cho dữ liệu vững chắc ở mức tối thiểu. Do đó, xác nhận phạm vi động xử lý cả các định lượng nhỏ và các phạm vi nồng độ lớn hơn mà không có bất kỳ biến dạng nào, giúp duy trì tính toàn vẹn dữ liệu trong suốt các loạt thí nghiệm mở rộng và hỗ trợ các kết luận đáng tin cậy trong công việc phân tích.
Thiết kế quang học ảnh hưởng đến chất lượng đo lường như thế nào?
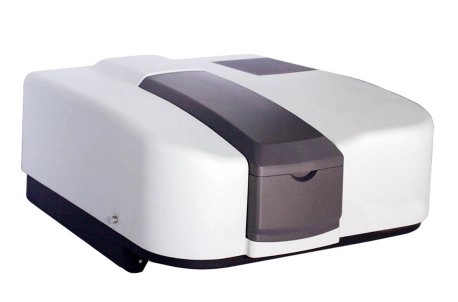
Máy quang phổ chùm đơn cung cấp một con đường thân thiện với ngân sách nhưng có thể đối mặt với sự thay đổi cơ bản. Hãy xem xét kỹ cài đặt monochromator. Thiết kế Czerny-Turner kết hợp với lưới holographic cung cấp độ phân giải tốt và ánh sáng lạc lùng thấp. Các công cụ như Máy quang phổ UV-Vis T8DCS cho phép lựa chọn băng thông từ 0,1-5 nm mà không nghỉ ngơi và sử dụng máy dò ống nhân quang cho khả năng phản ứng hàng đầu.
Phần mềm đóng vai trò gì trong hiệu quả quang phổ?
Tìm phần mềm thân thiện với người dùng giúp dễ dàng thiết lập phương pháp và hỗ trợ xử lý nhóm. Các tùy chọn như kiểm tra động học, lớp phổ và sửa chữa dòng cơ bản tự động tăng đầu ra, giúp các nhóm làm việc thông minh hơn và nhanh hơn trong khi giải quyết các bộ dữ liệu phức tạp trong thói quen phòng thí nghiệm hàng ngày. Các đơn vị tiên tiến hơn liên kết với LIMS và xử lý xuất khẩu theo một số phong cách. Máy quang phổ UV-Vis T7 Máy quang phổ UV-Vis T7 cung cấp các công cụ mạnh mẽ thông qua phần mềm UV-Win của mình, bao gồm các quan điểm quang phổ 3D và quản lý GLP.
Sự khác biệt cốt lõi giữa máy quang phổ UV-Vis, IR và huỳnh quang là gì?
Máy quang phổ UV-Vis hoạt động trong băng tần 190-1100 nm. Phổ quang học hoạt động như một cách để đánh giá cách một chất hóa học hấp thụ hoặc cho phép ánh sáng qua bằng cách gửi một chùm ánh sáng qua một dung dịch với vật phẩm trong câu hỏi. Chúng phù hợp hoàn hảo với việc tính toán nồng độ với định luật Beer-Lambert, kiểm tra động học và kiểm tra chất lượng. Lợi ích bao gồm thời gian quét nhanh và sử dụng rộng rãi trong các lĩnh vực. Nhược điểm cho thấy chi tiết cấu trúc - UV-Vis bỏ lỡ phát hiện các nhóm chức năng phân tử, hạn chế chiều sâu của nó trong một số nghiên cứu cấu trúc.
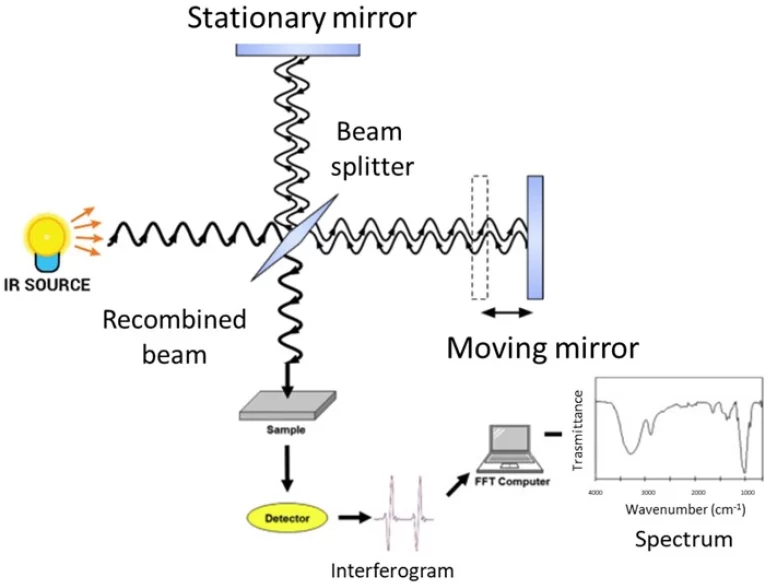
Khi nào quang phổ IR có lợi hơn?
Máy quang phổ hồng ngoại kiểm tra độ rung phân tử trong khu vực hồng ngoại trung (4000-400 cm) ⁻¹). Họ tỏa sáng khi tìm các nhóm chức năng trong các xây dựng hữu cơ khó khăn. Nó phát hiện các rung phân tử ở khu vực hồng ngoại trung (thường là 4000-400 cm). ⁻¹).
Điều gì làm cho các kỹ thuật huỳnh quang lý tưởng cho việc phát hiện mức độ dấu vết?
Phổ huỳnh quang theo dõi ánh sáng phát ra sau khi khuấy. Nó cho thấy khả năng phản ứng tuyệt vời - có thể thu thập chất phân tích ở số lượng sub-nanomolar - và chọn một cách chọn lọc thông qua thẻ fluorophore. Bánh răng huỳnh quang thường có một bộ kích thích monochromator, hoạt động như một bộ lọc có thể điều chỉnh cho ánh sáng khuấy, cộng với một quang phổ phát ra để lan rộng phổ phát ra. Một nhược điểm chính liên quan đến việc cần một ánh sáng tự nhiên hoặc thêm thẻ. Photobleaching cũng có thể làm suy yếu các thử nghiệm đang diễn ra, yêu cầu các phương pháp được điều chỉnh để bảo tồn chất lượng tín hiệu.
Kỹ thuật nào phù hợp nhất với mục tiêu phân tích của bạn?
Độ nhạy cảm: Hồng quang > UV-Vis > IR.
Độ chọn lọc: IR > Hồng quang > UV-Vis.
Độ chính xác định lượng: UV-Vis > Hồng quang > IR
Công nghệ khác nhau phù hợp với các mục tiêu phân tích độc đáo. Lấy huỳnh quang, dẫn đến phát hiện phân tử sinh học; IR nổi bật cho kiểm tra cấu trúc; Các quy tắc UV-Vis làm việc trên các hỗn hợp rõ ràng, mỗi quy tắc mang lại điểm mạnh cho các thách thức và quy trình làm việc trong phòng thí nghiệm cụ thể.
Những cân nhắc thực tế là gì ngoài hiệu suất?
UV-Vis thiết bị thường chi phí ít hơn với ít bảo trì. Các đơn vị IR có thể cần các chất sấy hoặc thanh lọc khí chống lại tác động không khí. Các thiết lập huỳnh quang yêu cầu điều chỉnh chính xác do rủi ro mờ dần. Đọc mẫu cũng thay đổi: những mẫu dựa trên nước phù hợp với UV-Vis; các vật phẩm cứng và bụi đi với IR; các điều chỉnh hóa học có thể phù hợp với các thử nghiệm huỳnh quang, điều chỉnh chuẩn bị cho phương pháp’ s quirks cho kết quả mượt mà.
Làm thế nào mà các công cụ này có thể tích hợp liền mạch vào các quy trình làm việc hiện có?
Hôm nay’ Các máy quang phổ thường quay trở lại bộ cung cấp tự động, chạy nhóm và xử lý xa thông qua API hoặc chương trình mạng. Các tính năng như vậy quan trọng rất nhiều ở các điểm bận rộn theo đuổi lặp lại ổn định, hợp lý hóa các hoạt động và cắt giảm thời gian thực hành để có hiệu quả tốt hơn.
Các hệ thống này có hỗ trợ đường ống đa kỹ thuật không?
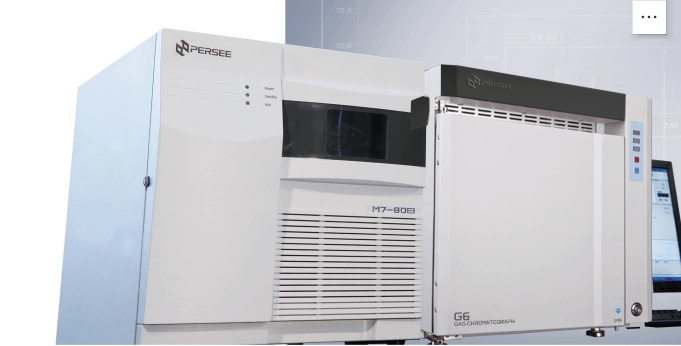
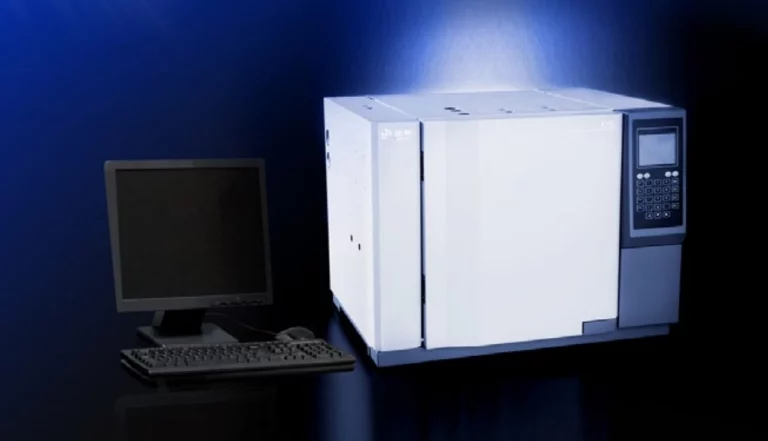
Các công cụ Spectro liên kết thường xuyên với các hệ thống tách như HPLC hoặc GC. Các đơn vị khí như G5-GC cung cấp xây dựng linh hoạt và máy dò sâu sắc kết hợp với phát hiện quang phổ trong hỗn hợp khó khăn. Dòng khí ổn định và xử lý nhiệt, cùng với máy dò sâu sắc, mang lại kết quả chất lượng và định lượng sắc nét hơn, tăng cường phân tích trong các lĩnh vực khó khăn như kiểm tra sinh thái hoặc sản xuất thuốc.
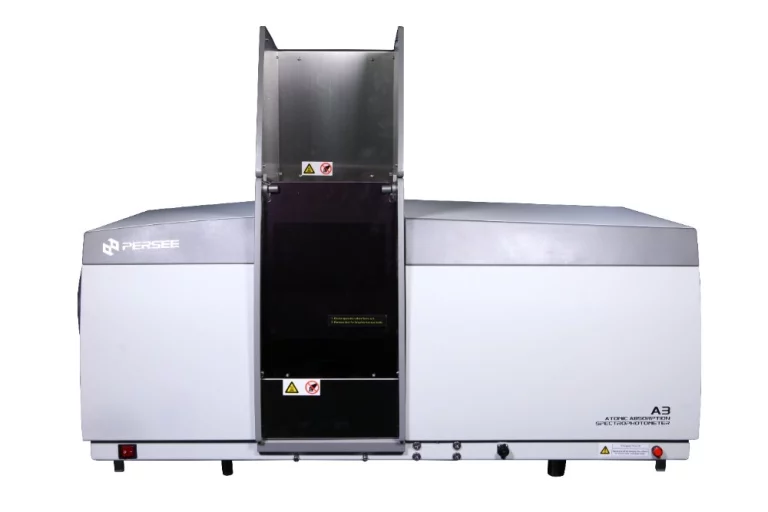
Tại sao PERSEE được Labs Worldwide tin tưởng?
Trong hơn ba mươi năm, PERSEE đã dẫn đầu trong thiết bị phân tích - cung cấp cho các phòng thí nghiệm trên toàn cầu các câu trả lời mới trong quang phổ phân tử, nhiễm sắc, quang phổ nguyên tử và hơn thế nữa, xây dựng một tên cho sự đổi mới đáng tin cậy đáp ứng các yêu cầu khoa học đa dạng.
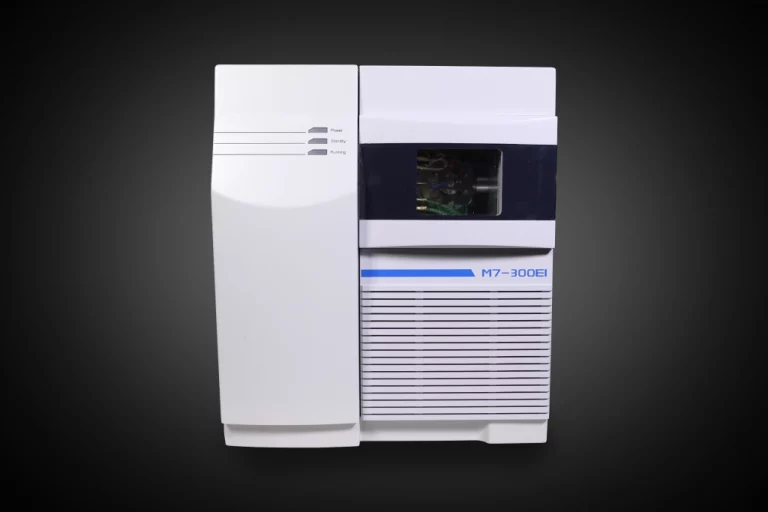
Các nền tảng hàng đầu của họ có các mục chính như FTIR8000 Infrared Spectrometer cho phát hiện nhóm và M7 GC-MS cho quét sinh thái và dược phẩm đầy đủ. M7 Single Quadrupole GC-MS là một máy quang phổ khối lượng mới, hiệu suất cao từ Persee. Được hỗ trợ bởi mạng lưới trên toàn thế giới và đẩy ổn định trong phần mềm tự động, PERSEE vượt xa việc làm cho nó ’ s phòng thí nghiệm của bạn’ Đồng minh quan trọng, cung cấp các công cụ và kiến thức để thành công lâu dài trong việc theo đuổi nghiên cứu.
Câu hỏi thường gặp
Q1: Một quang phổ có thể bao gồm cả phạm vi UV-Vis và IR không?
A1: Thông thường không Máy quang phổ UV-Vis hoạt động trong phạm vi 190-1100 nm trong khi các thiết bị IR bao gồm 4000-400 cm ⁻ ¹ sử dụng quang học và máy dò khác nhau.
Q2: Làm thế nào để xác định xem phát hiện huỳnh quang là cần thiết cho ứng dụng của tôi?
A2: Nếu chất phân tích mục tiêu của bạn có mặt ở mức siêu dấu vết hoặc yêu cầu phát hiện chọn lọc thông qua các đầu dò được dán nhãn (ví dụ: các dấu hiệu sinh học), huỳnh quang cung cấp độ nhạy cao hơn so với các phương pháp dựa trên độ hấp thụ.
Q3: Điều gì cần bảo trì cho hiệu suất lâu dài của máy quang phổ?
A3: Kiểm tra hiệu chuẩn thường xuyên sử dụng các tiêu chuẩn được chứng nhận, làm sạch các thành phần quang học và thay thế đèn / máy dò theo hướng dẫn của nhà sản xuất đảm bảo độ chính xác nhất quán theo thời gian.