การเข้าใจการทํางานของเครื่องวัดสเปคโตรโฟโตเมตร UV-VIS เริ่มต้นด้วยการรู้ความคิดพื้นฐานของมัน วิธีนี้ใช้กันอย่างกว้างขวางในห้องทดลองเคมีและชีววิทยา มันทำงานได้ดี เพราะมันให้ตัวเลขที่น่าเชื่อถือและแม่นยำ สารเคมีทุกสารเข้าไป ปล่อยให้ผ่าน หรือกลับกลับแสง ซึ่งเป็นรูปของคลื่นไฟฟ้าแม่เหล็ก ในช่วงความยาวคลื่นบางอย่าง เครื่องวัดแสง UV-VIS ใช้ข้อเท็จจริงนี้เพื่อหาปริมาณหรือประเภทของวัสดุในผสมของเหลว
พื้นฐานทฤษฎีของการดูดซึม UV-VIS
การดูดซึมแสงอัลตราไวโอเลตและแสงที่มองเห็นได้โดยโมเลกุล มาจากการเปลี่ยนแปลงของอิเล็กทรอน โดยเฉพาะอย่างยิ่ง อิเล็กทรอนกระโดดจากจุดพลังงานต่ำในโมเลกุล ไปยังจุดพลังงานสูงขึ้น กลุ่มที่เรียกว่า โครโมโฟร์ เช่น การเชื่อมโยงคู่ระหว่างคาร์บอน หรือโครงสร้างแหวนในกลิ่นหอม ทําให้เกิดการดูดซึมเหล่านี้ พวกเขายังรูปร่างคุณสมบัติสำคัญของโมเลกุล’ รูปแบบแสง
พันธมิตรที่เชื่อมโยงกันเพิ่มความยาวคลื่นหลักของการดูดซึม ที่รู้จักกันในชื่อ λmax นี่เกิดขึ้นเพราะสถานการณ์ที่ตื่นเต้นกลายเป็นที่มั่นคงมากขึ้น กลุ่มข้างต่างๆ รับแสงในพื้นที่ทั่วไป นี่ช่วยในการตรวจสอบพื้นฐานเกี่ยวกับสิ่งที่มีอยู่ ด้านที่ใช้ตัวเลขตามกฎ Beer-Lambert: A = ε × c × l ที่นี่: A หมายถึงการดูดซึม ε หมายถึงการดูดซึมโมลาร์ c คือความเข้มข้น (mol/L) l คือความยาวเส้นทาง (cm) ลิงค์นี้ยังคงตรงในพื้นที่การดูดซึมที่กําหนดไว้ มักจะเป็น 0.2-1.0 AU เส้นตรงนั้นเป็นกุญแจสําหรับการนับตัวเลขที่ถูกต้อง
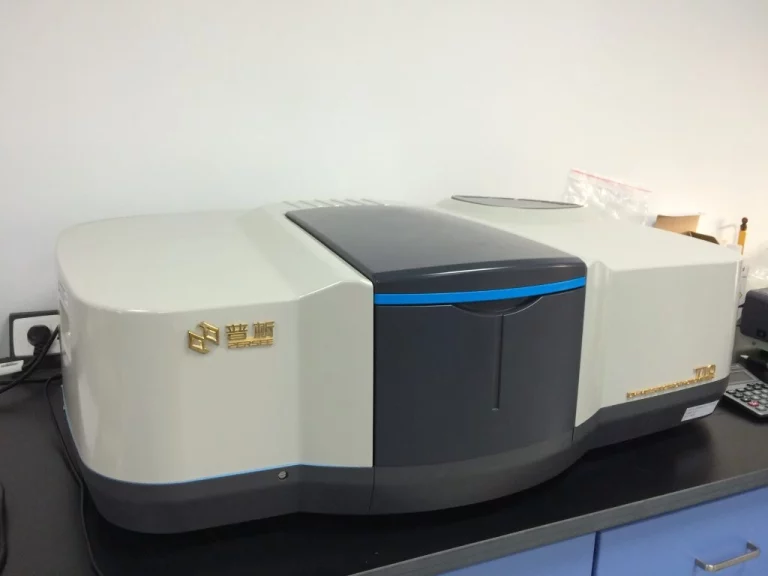
ส่วนประกอบเชิงอุปกรณ์ของเครื่องสเปกโทรโฟโตมิเตอร์ UV-VIS
เพื่อให้ได้รับการอ่านที่แม่นยำและคงที่เครื่อง’ s สร้างประกอบด้วยหลายส่วนหลัก:
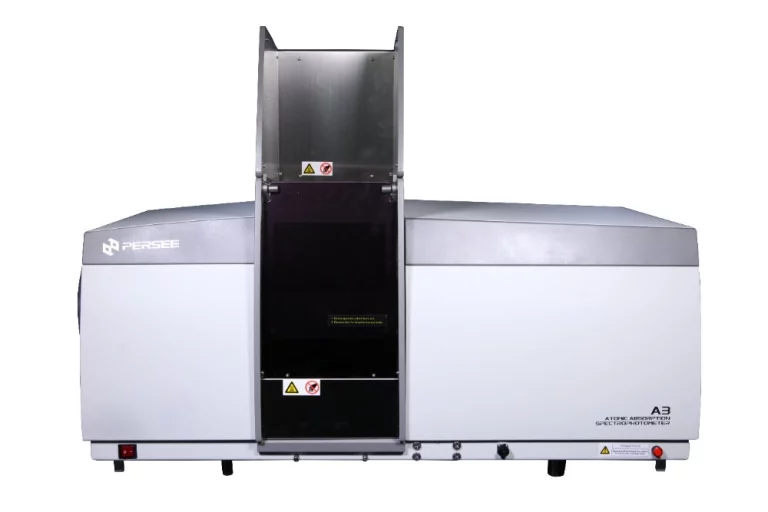
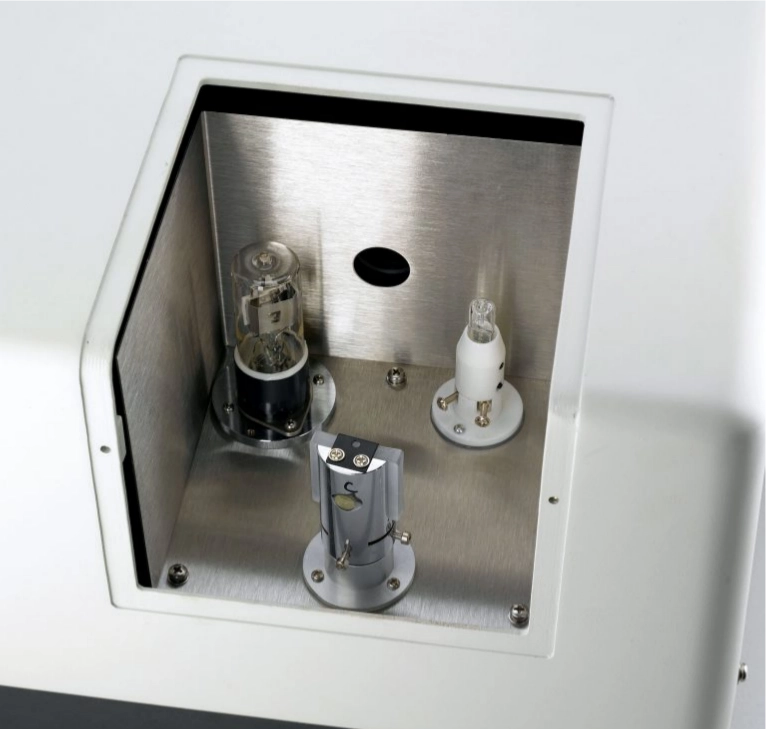
แหล่งแสง: โคมไฟดูเทเรียมจัดการ UV (190-400 นาโนเมตร) โคมไฟทังสเตน-ฮาโลเจนที่มองเห็นได้ (400-700 นาโนเมตร)
โมโนโครมาเตอร์: พวกเขาใช้ปริสมัหรือตะแกรงการแยกเพื่อเลือกความยาวคลื่นบางอย่าง ความยาวคลื่นที่เลือกผ่านช่องออกไปยังตัวอย่าง
แสงจากแหล่งที่มาผ่านช่องทางเข้าใน monochromator แยกนี้ทำให้ลำแสงมีขนาดที่สามารถทำได้ ต่อไป มันเดินทางผ่านตะแกรงการแยกแยก ที่นั่น แสงแบ่งออกเป็นแถบแคบ ของแสงสีเดียว
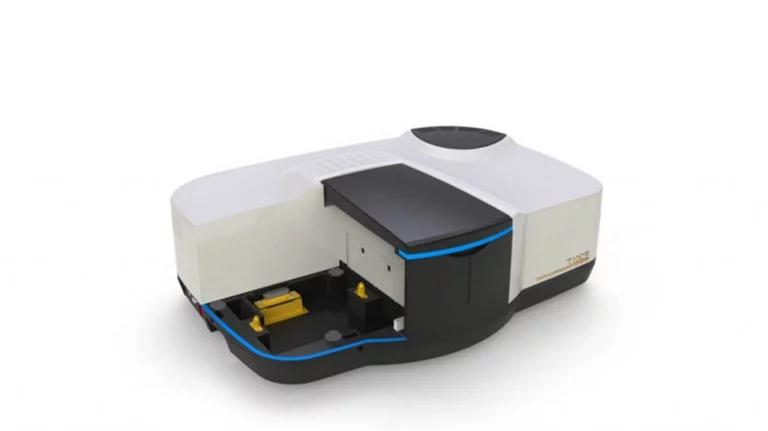
ช่องตัวอย่าง: พวกเขาถือ cuvettes, มักจะทำจากควอตซ์สำหรับ UV, แก้วสำหรับ VIS, หรือพลาสติก, ความยาวเส้นทาง, โดยปกติ 1 ซม., ต้องอยู่เหมือนกันสำหรับการเปรียบเทียบที่ยุติธรร
เครื่องตรวจจับ: โฟโตไดโอดและท่อ photomultiplier เปลี่ยนแสงที่ผ่านไปเป็นสัญญาณไฟฟ้า ซอฟต์แวร์ที่จัดการสัญญาณเปลี่ยนนี้เป็นตัวเลขการดูดซับหรือรูปแบบแสงเ
ความต้องการก่อนการทำงานและการตั้งค่าระบบ
ก่อนการทดสอบใด ๆ การตั้งค่าและตรวจสอบที่ดีให้แน่ใจว่า สเปคโตรโฟโตเมตร ให้ผลลัพธ์ที่แข็งแกร่ง นี่ครอบคลุมการตั้งค่ากลที่ใช้แสง และการตั้งค่าโปรแกรม
การปรับเทียบเครื่องมือและการแก้ไขฐาน
การตรวจสอบสําคัญสําหรับการอ่านที่แท้จริง:
ความแม่นยำของความยาวคลื่น: ตรวจสอบด้วยรายการทดสอบที่ได้รับการอนุมัติเช่นกรองโฮลเมียมออกไซด์ เช่นเครื่องมืออื่น ๆ พวกเขาต้องการความคิดเห็นและหลักฐานอย่างต่อเนื่อง สําหรับเครื่องวัดสเปคโตรโตเมตร การทดสอบครอบคลุมความแม่นยำของโฟโตเมตริก (ความตรงการดูดซับ) ความแม่นยำของความยาวคลื่น ความกว้างของแบนด์และแสงที่หลงทาง
การแก้ไขฐาน: แก้ไขปัญหาจากแสงและเสียงพื้นหลัง คุณทำแบบนี้โดยการสแกนว่างเปล่า ซึ่งเป็นถังที่มีเพียงตัวทำละลาย ผ่านช่วงความยาวคลื่น
การเลือกและการเตรียมคิวเวตต์และตัวอย่าง
วัสดุที่จับคู่มีความสำคัญมาก:
| ภูมิภาค Spectral | ชนิด Cuvette | หมายเหตุ |
|---|---|---|
| UV (< 300 นาโนเมตร) | ควอตซ์ | ความโปร่งใสสูง |
| VIS (> 320 นาโนเมตร) | แก้ว / พลาสติก | พลาสติกไม่เหมาะสำหรับ UV |
ให้แน่ใจว่าตัวอย่างชัดเจนและสม่ำเสมอ
เก็บความเข้มข้นในพื้นที่การดูดซับตรง (0.2-1.0 AU)
การตั้งค่าซอฟต์แวร์และการตั้งค่าวิธี
เครื่องวัดสเปคโตรโฟโตเมตรใหม่มีวิธีการสร้างวิธีการตามโปรแกรม: รายละเอียดการสแกนรวมถึงความยาวคลื่น, ความเร็วในการสแกน, ความกว้างของช่อง, รูปแบบการเก็บเพื่อให้วิธี
การใช้งานตามขั้นตอนของเครื่องวัดสเปคโฟโตมิเตอร์ UV-VIS
หลังจากการตั้งค่า การไหลที่ชัดเจนตามขั้นตอนทําให้แน่ใจว่าข้อมูลถูกต้อง มันจากการเพิ่มตัวอย่างไปยังผลการอ่าน
ขั้นตอนการเปิดและอุ่น
เริ่มต้นด้วยการเริ่มต้นเครื่องที่ถูกต้อง: เปิดเครื่องมือและปล่อยให้โคมไฟอบอุ่นประมาณ 20-30 นาที นี่ทำให้ความร้อนมั่นคง การตรวจสอบในตัวยืนยันการตั้งค่า ความแข็งแรงของหลอดไฟ และการทำงานของเครื่องตรวจจับ
การวัดว่างและศูนย์เครื่องมือ
ของเหลวที่ว่างเปล่า มีตัวทำละลายเท่านั้น จะได้รับการวัดก่อน มันกำหนดจุดเริ่มต้นของการดูดซึมที่แต่ละความยาวคลื่น ใส่ถังเดียวกันเสมอ นี่จะหลีกเลี่ยงปัญหาการดัดแสง
โปรโตคอลการวัดตัวอย่าง
วิธีการที่คุณวัด ขึ้นอยู่กับสิ่งที่คุณต้องการหา โหมดที่แตกต่างกันเหมาะกับความต้องการที่แตกต่างกัน
โหมดวิเคราะห์ความยาวคลื่นเดียว
โหมดนี้เหมาะกับการตรวจสอบตามหมายเลขโดยส่วนใหญ่: ตั้งเครื่องมือให้เป็น analyte’ s λmax และอ่านตัวอย่าง’ การดูดซึม s จากนั้น จับคู่กับเส้นการปรับเทียบ
โหมดสแกนเต็มสเปกตรัม
นี่ทํางานได้ดีที่สุดสําหรับการศึกษาพื้นฐาน: จับรูปแบบการดูดซึมทั้งหมด, เช่น 200-800 นาโนเมตร, จุดสูงสุดเพื่อตรวจสอบสิ่งที่วิเคราะห์เป็นห
การทำงานในโหมดจลศาสตร์ (ถ้ามี)
สําหรับการดูปฏิกิริยา: ล็อคความยาวคลื่นที่ λmax, ใช้การอ่านความดูดซับในช่วงเวลา นี่แสดงความเร็วของปฏิกิริยา
เทคนิคการประมวลผลและตีความข้อมูล
หลังจากอ่าน การวิเคราะห์จะดึงข้อเท็จจริงที่มีประโยชน์จากข้อมูลการดูดซึม
การสร้างโค้งการปรับเทียบสำหรับการวิเคราะห์ปริมาณ
ขั้นตอนนี้คือการสร้างของเหลวมาตรฐานในปริมาณที่รู้จัก การอ่านความดูดซับของพวกเขา การวาดกราฟของความดูดซับกับความเข้มข้น และใช้คณิตศาสตร์เส้นตรงเพื่อให้ได้สูตรการปรับ
การวิเคราะห์สเปคตรลเพื่อความเข้าใจที่มีคุณภาพ
ดูรูปแบบสูงสุด, ขนาด, และจุด: ชัดเจน, แม้แต่สูงสุดมักจะหมายถึงตัวอย่างเป็นบริสุทธิ์, ลองวิธีการอนุพันธ์เพื่อจัดเรียงสูงสุดที่ซ้อนกั
การส่งออก การประหยัด และการรายงานผลลัพธ์
เครื่อง’ โปรแกรม s ทําให้คุณส่งข้อมูลในหลายแบบฟอร์ม CSV สําหรับโปรแกรมตาราง, PDF สําหรับรายงาน, แบบฟอร์มพิเศษสําหรับการตรวจสอบในภายหลัง และล
โปรโตคอลการบำรุงรักษาและแนวทางแก้ไขปัญหา
เพื่อการทำงานที่ดีอย่างยั่งยืน การดูแลเป็นประจํา และการแก้ไขอย่างรวดเร็ว ทําให้สิ่งที่ทำได้ดี
การบำรุงรักษาประจำ
งานรวมถึงการแลกเปลี่ยนโคมไฟดิวเตอริยม / ทังสเตนได้ตามเวลาในการใช้งาน, เช็ดถัง, จุดตัวอย่าง, และเส้นทางแสงมักจะต้องตรวจสอบ, การควบคุมคุณภาพ, การพิสูจน์วิธีการ, และการ นี่มาจากกฎห้องทดลองที่ดี หรือกฎที่กําหนดโดยกฎหมาย
แก้ไขปัญหาการทำงานที่พบบ่อย
เหตุผลอาจคือความไม่สม่ำเสมอของหลอดไฟ ชิ้นส่วนแสงสกปรก และการขัดขวางพลังงาน
การอ่านความยาวคลื่นที่ไม่ถูกต้อง
นี่มักจะเกิดขึ้นจาก monochromator ออกจากสายและมาตรฐานตรวจสอบที่สึกหรอ
ไฮไลต์ เพอร์ส เป็นผู้ผลิตที่เชื่อถือได้ในเครื่องมือวิเคราะห์
PERSEE ได้สร้างชื่อที่แข็งแกร่งในฐานะผู้ผลิตเครื่องมือสเปคตรสโกปีที่แม่นยำ บริษัท เน้นความคิดใหม่แสดงให้เห็นว่าพวกเขาผสมเทคโนโลยีเบากับโปรแกรมวิเคราะห์ที่ฉลาด
ภาพรวมความเชี่ยวชาญของ PERSEE ในโซลูชั่นสเปคโทรสโกปี
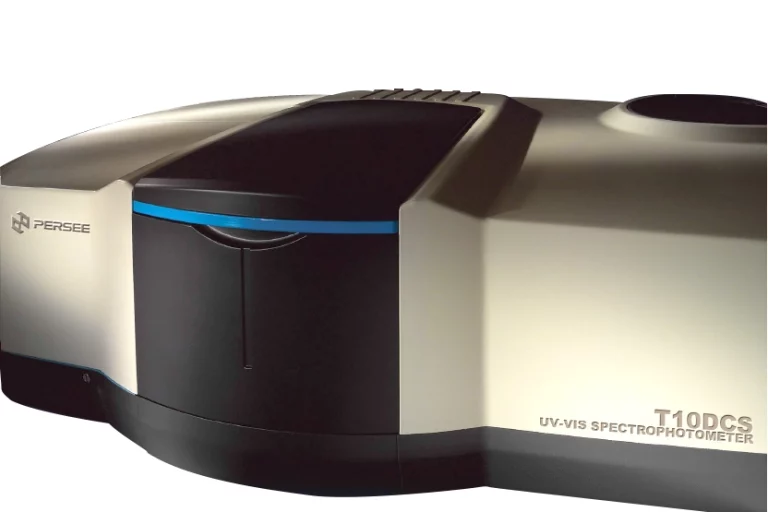
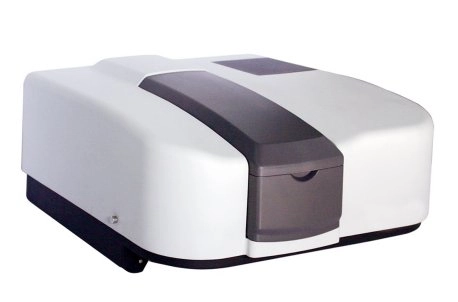
ด้วยการสร้างเครื่องมือการวิเคราะห์หลายปี PERSEE ให้บริการเครื่องวัดสเปคโตรโฟโตเมตรที่แข็งแกร่งและใช้งานง่าย พวกนี้เหมาะกับงานประจําวัน และความต้องการในการวิจัยอย่างลึกซึ้ง
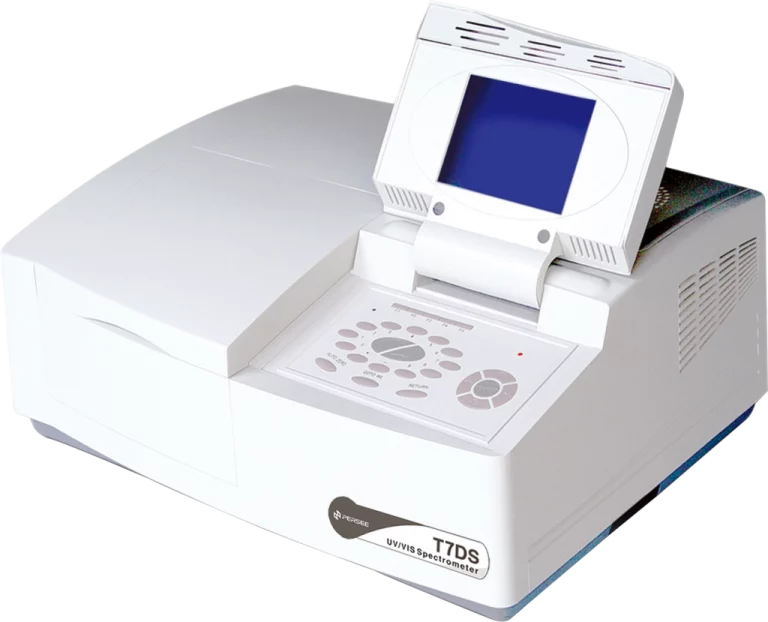
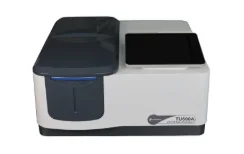
รุ่นที่แนะนำ: PERSEE M7 และ G5 Series
นี่เหมาะกับงานที่มีรายละเอียดสูง การตั้งค่าสองโคมไฟให้ความครอบคลุมของแสงที่กว้างขวาง สไตล์สองลำแสงตัดการเปลี่ยนแปลงเส้นพื้นฐานและแก้ไขการเปล
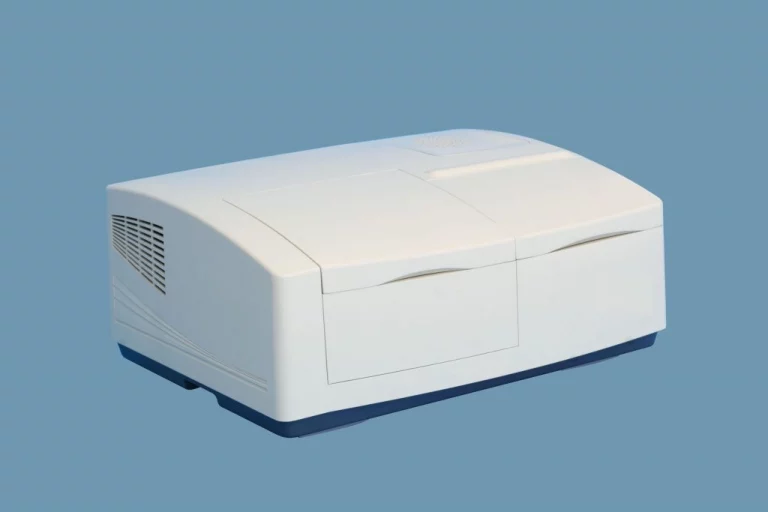
ซีรีส์ G5GC ระบบ UV-VIS
ออกแบบมาสําหรับสภาพแวดล้อมที่มีการจราจรสูง ระบบให้การประมวลผลอัตโนมัติสําหรับตัวอย่างปริมาณสูงผ่านโปรแกรมที่แข็งแกร่งและปรับตัวได้ท
การพิจารณาการดําเนินงานที่สำคัญ
ผลลัพธ์ที่จริงและซ้ำขึ้นอยู่กับขั้นตอนที่ระมัดระวัง: ทำการแก้ไขฐานถูกต้อง, เลือกถังที่เหมาะสมสำหรับพื้นที่แสง, ตรวจสอบวิธีการตอนนี้และจากนั้นด้วยมาตรฐานที่ได้รับการอนุมัติ, การรักษาข้อม
คำถามที่พบบ่อย
Q1: ช่วงการดูดซึมที่เหมาะสมสําหรับผลปริมาณที่แม่นยำคืออะไร?
A1: พื้นที่ดูดซึมที่ดีที่สุดคือระหว่าง 0.2-1.0 AU ค่ากว่านี้อาจนําความโค้งหรือสัญญาณเต็ม
Q2: ฉันสามารถใช้ถังพลาสติกสำหรับการวัดในภูมิภาค UV ได้หรือไม่?
A2: ถังพลาสติกมักจะไม่ทำงานต่ำกว่า 300 นาโนเมตร พวกเขาขาดความชัดเจน UV ที่ดี ใช้ cuvettes ควอตซ์สำหรับการทำงาน UV
Q3: ฉันควรปรับเทียบเครื่องวัดสเปคโฟโตมิเตอร์ใหม่บ่อยเท่าไหร่?
A3: ตรวจสอบทุกเดือนในระหว่างการใช้งานปกติ ทํามันมากขึ้น ถ้าการทดสอบที่สำคัญกำลังมา