Спектрофотометрия служит жизненно важным аналитическим методом, обычно используемым в химических, биологических и биологических лабораториях. Его успех в измерении концентраций растворенных веществ зависит от основных правил, которые связывают поглощение света с молекулами, присутствующими в растворе.
Основы поглощения света и пропускаемости
Спектрофотометры функционируют, измеряя количество света, которое образец принимает или пропускает. Количество света, которое поглощает образец на определенной длине волны, связано прямо с образцом’ с концентрацией.
Закон Пива-Ламберта в количественном анализе
Этот основной закон поддерживает количественную сторону спектрофотометрии. Ожидается прямая связь между поглощением и концентрацией, когда условия остаются стабильными, такие как фиксированная длина пути, одноцветный свет и растворенные вещества, которые не смешиваются друг с другом. Независимо от того, насколько сложны дела, все спектрофотометрические приборы основаны на ключевых идеях закона Бира-Ламберта. Тем не менее, сдвиги от ожидаемого шаблона могут произойти из-за ограничений инструмента, таких как блуждающий свет или неравномерные пропускные способности, или из-за особенностей образца, таких как химические изменения или скопление. Чтобы убедиться, что результаты тесно соответствуют закону, необходимо проверить процедуры, которые используют утвержденные стандарты.
Приборы и конфигурация спектрофотометров
Успех спектрофотометрической работы в значительной степени зависит от того, насколько хорошо работает оборудование и как оно настроено.
Ключевые компоненты спектрофотометра
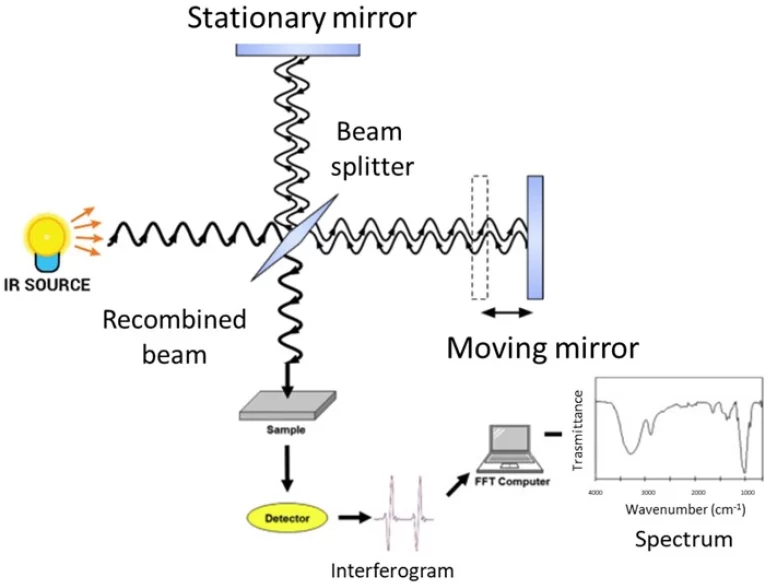
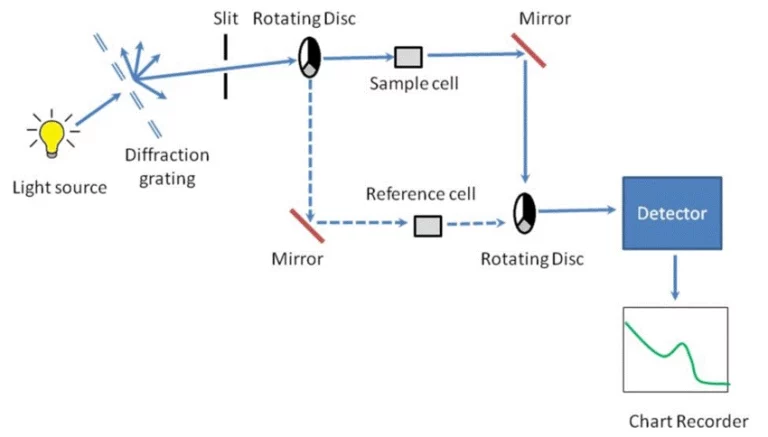
Типичный спектрофотометр содержит источник света: вольфрамовые лампы для видимых спектров (400-700 нм) и дейтериевые лампы для ультрафиолетового региона (190-400 нм). Монохроматор: использует призмы или дифракционные решетки для изоляции определенных длин волн. Держатель образца: обычно кварцевые или стеклянные куветы с известной длиной пути (обычно 1 см). Детектор: преобразует передаваемый свет в электрический сигнал.
Свет от источника проходит через входную щелину в монохроматоре, которая сужает луч до пригодного для использования размера. Затем свет проходит через выходную щелину, которая позволяет свету выбранной длины волны проходить через образец, где часть его поглощается.
Виды спектрофотометров и их применение
Решение о типе инструмента сводится к тому, что требует анализ:
Системы с одним лучом и двумя лучами
Один луч: Проще конструкция; Измерения требуют частого отбелывания. Двойный луч: разделяет луч, чтобы одновременно проходить через образец и ссылку, улучшая стабильность.
UV-Vis против только видимых инструментов
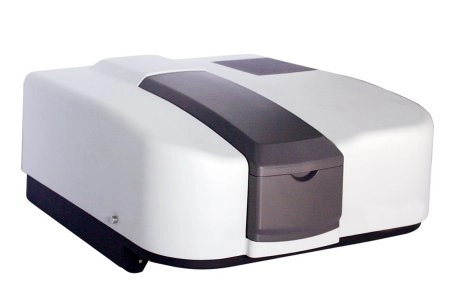
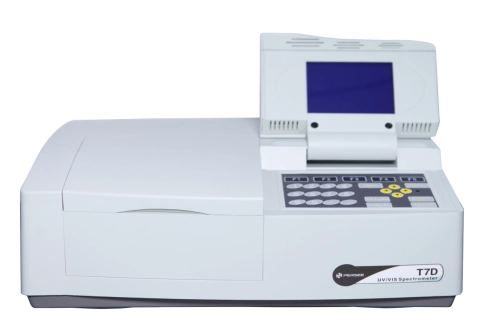
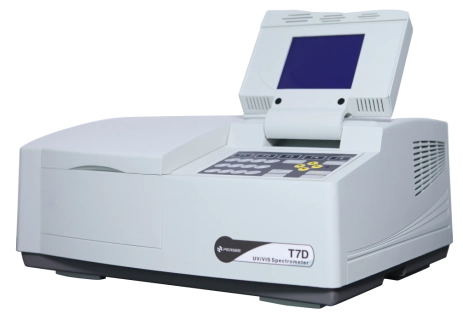
UV-Vis: охватывает широкий спектральный диапазон (190-1100 нм), подходит для различных соединений. Только видимые: ограничены 400-700 нм; Идеально подходит для цветных веществ. Т7Д/Т7ДС это высокопроизводительный двойный лучевой сканирующий спектрофотометр, способный проводить фотометрические измерения, спектральное сканирование, количественные определения и анализ ДНК/белков.
Стратегии подготовки образцов для надежных результатов
Частицы рассеивают свет, приводя к переоцененным значениям поглощения. Образцы должны быть четкими и равномерными. Гомогенные образцы обеспечивают последовательное взаимодействие оптического пути.
Протоколы выбора растворителя и коррекции пустоты
Растворитель не должен поглощаться на аналитических длинах волн. Бланки, содержащие только растворитель, используются для учета фоновой абсорбции растворителя и куветы.
Правильное использование куветок и соображения по длине пути
Кварцевые куветы необходимы для измерений УФ из-за их прозрачности ниже 320 нм, в то время как пластика или стекла достаточно для видимого диапазона. Постоянная ориентация во время использования минимизирует изменчивость, вызванную несовершенствами.
Разработка метода определения концентрации
Создание надежного метода требует организованных шагов калибровки и твердых привычек измерения.
Техники строительства кривой калибровки
Выбор оптимальных длин волн для анализа
Выберите λmax, чтобы максимизировать чувствительность, избегая перекрывающихся помех матрицы.
Процедуры измерения образцов и проверки данных
Репликаты, средние и более высокие критерии отказа
Измерите каждый образец в трех экземплярах. Выбросить отклонения на основе статистического отклонения или наблюдаемой ошибки.
Контроль качества с использованием внутренних стандартов или справочных материалов
Внутренние стандарты помогают корректировать эффекты дрейфа или матрицы. Сертифицированные справочные материалы подтверждают долгосрочную эффективность метода.
Передовые методы повышения точности и чувствительности
Сегодня’ Спектрофотометры обеспечивают компьютерные улучшения, которые повышают качество данных.
Базовая коррекция и алгоритмы спектрального сглаждения
Изнятие исходной линии устраняет интерференции фона. Изглаждение уменьшает шум, сохраняя при этом пиковую целостность.
Использование производной спектрофотометрии
Первые или вторые производные уточняют перекрывающиеся пики в сложных матрицах, особенно полезные в фармацевтическом или экологическом анализе.
Устранение распространенных ошибок в спектрофотометрическом анализе
Регулярное обслуживание и решение проблем поддерживают стабильную производительность.
Проблемы инструментального дрейфа и калибровки
Как и все приборы, они требуют регулярной проверки и валидации. Эти протоколы проверки и валидации обеспечивают доверие ко всем оперативным и эксплуатационным вопросам. Калибровка с использованием отслеживаемых стандартов должна проводиться регулярно.
Мехи от компонентов матрицы или туманности
До измерения следует фильтровать или центрифугировать мутные образцы. Частицы рассеивают свет и влияют на точность поглощения.
Подходы к минимизации матричного эффекта
Используйте стандарты, совпадающие с матрицами, или применяйте стандартные методы добавления, когда матрицу нельзя удалить.
PERSEE как надежный производитель аналитических приборов
Пекинская компания Purkinje General Instrument Co., Ltd. (Персиимеет более 30-летний опыт в поставке надежных спектрофотометрических систем.
Обзор экспертизы PERSEE в области оптического прибора
Beijing Purkinje General Instrument Co., Ltd. - современное высокотехнологичное предприятие, основанное в 1991 году. Он специализируется на научных исследованиях и разработке приборов, производстве и продажах. Их продукция сертифицирована по ISO9001, ISO14001, CE и другим, обеспечивая глобальное соответствие стандартам качества.
Выключенные продукты, имеющие отношение к анализу концентрации
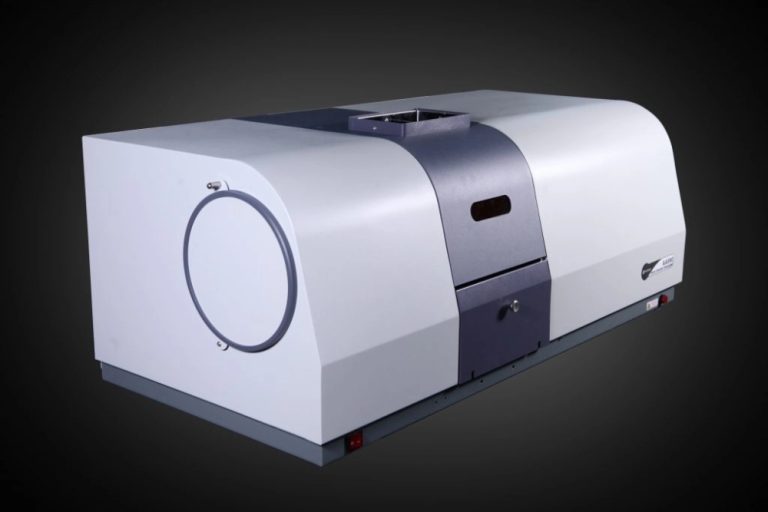
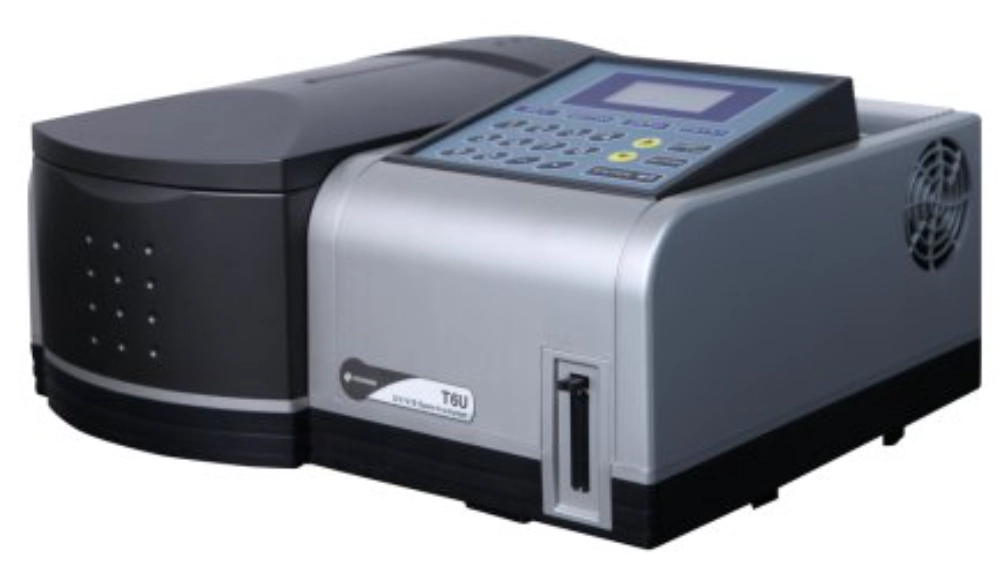
M7 двойный лучевой UV-VIS спектрофотометр
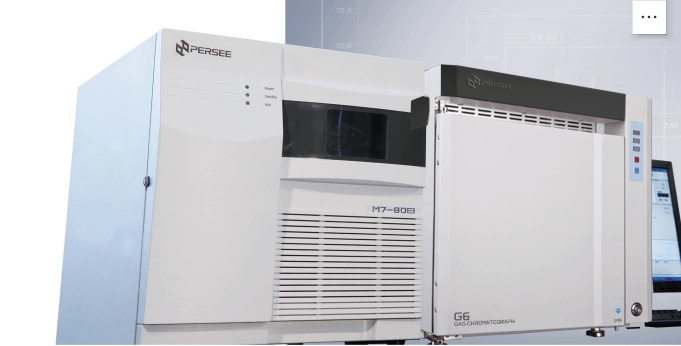
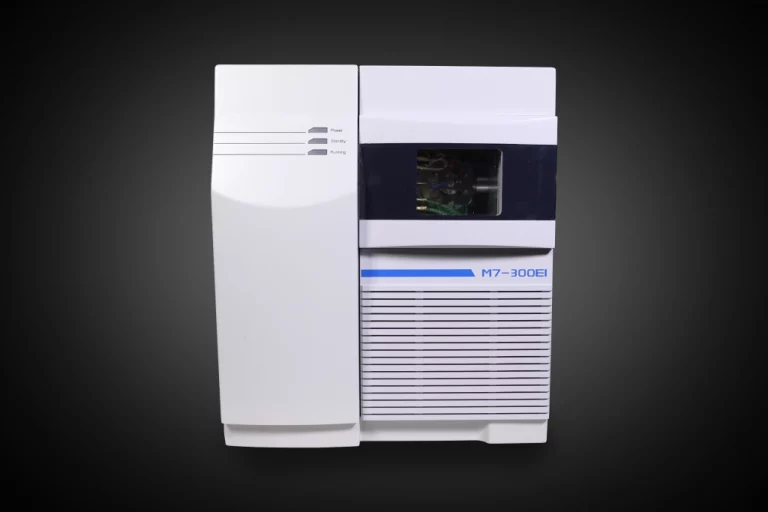
M7 Одиночный квадрупольный GC-MS это высокопроизводительный массовый спектрометр нового поколения, разработанный PERSEE, подходящий для рутинного анализа масс и точного исследования. Он предлагает оптику высокого разрешения с отличной базовой стабильностью в диапазоне 190-1100 нм.
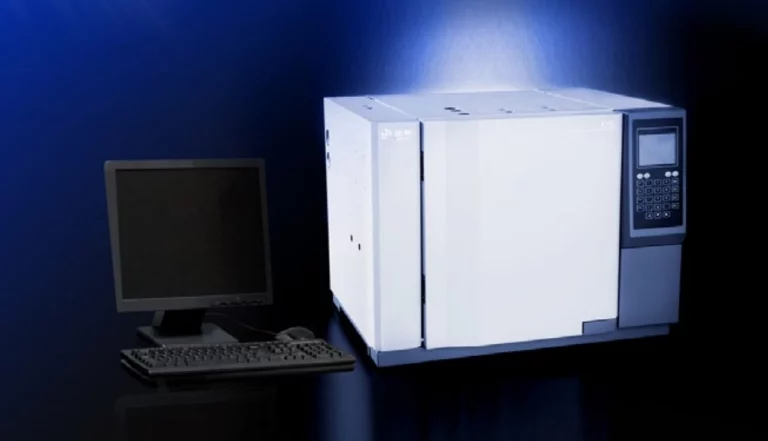
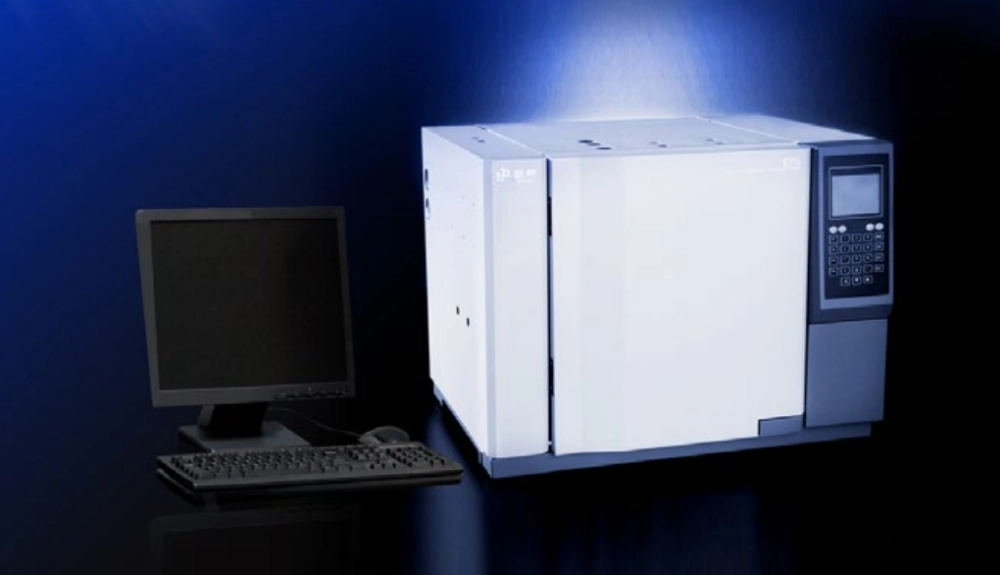
Система газового хроматографа G5GC
Стабильный поток газа и контроль температуры в сочетании с детектором высокой чувствительности дают вам более точные качественные и количественные результаты анализа. Г5ГК дополняет спектрофотометрические методы в мультимодальных анализах, таких как экологические испытания или фармацевтические рабочие процессы QA/QC.
Ключевые методы для точного определения концентрации
Обеспечить аналитическую точность, учитывая оптимальный выбор длины волны на основе λmax Точная подготовка стандартов калибровки. Устранение помех матрицы посредством подготовки образца. Поддержание калибровки прибора и проверки производительности.
Часто задаваемые вопросы
Q1: Какой идеальный диапазон длин волн использовать при анализе органических соединений?
A1: Большинство органических соединений поглощают в ультрафиолетовой области (200-400 нм), но точную длину волны следует выбрать на основе λmax соединения, определенного с помощью спектрального сканирования.
Q2: Как часто следует калибрировать спектрофотометр?
A2: Калибровка должна проводиться перед анализом каждой партии с использованием сертифицированных стандартов, при этом полная проверка производительности проводится ежемесячно в зависимости от частоты использования.
Q3: Могут ли облачные образцы анализироваться непосредственно с помощью спектрофотометра?
A3: Нет, туманность вызывает рассеяние света, что приводит к неточным показаниям поглощения; Образцы должны быть фильтрованы или центрифугированы до измерения.