Comprender el funcionamiento de un espectrofotómetro UV-VIS comienza con conocer sus ideas básicas. Este método encuentra un amplio uso en laboratorios de química y biología. Funciona bien porque da números fiables y exactos. Cada sustancia química absorbe, deja pasar o rebota la luz, que es una forma de ondas electromagnéticas, a través de ciertos rangos de longitud de onda. El espectrofotómetro UV-VIS utiliza este hecho para averiguar la cantidad o tipo de materiales en una mezcla líquida.
Base teórica de la absorción UV-VIS
La absorción de luz visible y ultravioleta por las moléculas proviene de cambios en los electrones. En particular, los electrones saltan de los puntos de baja energía en las moléculas a los de mayor energía. Los grupos llamados cromóforos, como los dobles enlaces entre los carbonos o las estructuras anulares en los aromáticos, causan estas absorciones. También dan forma a las características clave de una molécula’ s patrón de luz.
Los enlaces enlazados elevan la longitud de onda principal de absorción, conocida como λmax. Esto sucede porque los estados excitados se vuelven más estables. Varios grupos laterales toman luz en áreas típicas. Esto ayuda con controles básicos sobre lo que está presente. El lado basado en números sigue la Ley de Beer-Lambert: A = ε × c × l. Este enlace se mantiene recto en un área de absorbancia establecida, a menudo 0,2-1,0 UA.
Componentes instrumentales de un espectrofotómetro UV-VIS
Para obtener lecturas exactas y constantes, la máquina’ s build incluye varias partes principales:
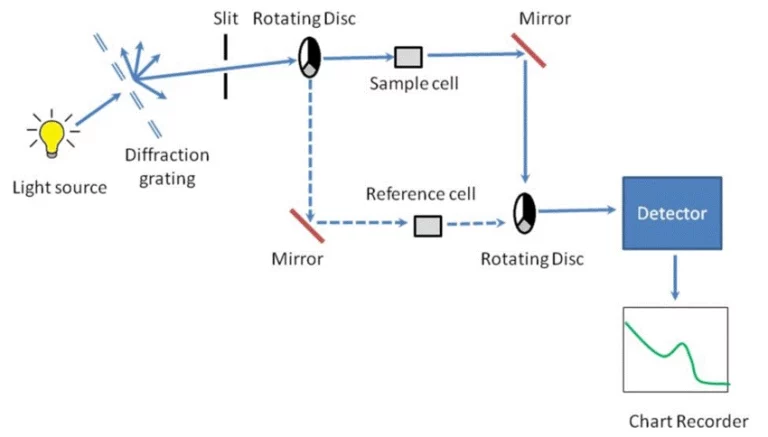
Fuentes de luzLas lámparas de deuterio manejan UV (190-400 nm), las lámparas de tungsteno-halógeno cubren visibles (400-700 nm)
MonocromadoresEmplean prismas o rejillas de difracción para seleccionar ciertas longitudes de onda, la longitud de onda elegida pasa a través de la hendidura de salida a la muestra.
La luz de la fuente pasa a través de una hendidura de entrada en el monocromator. Esta hendidura hace que la viga tenga un tamaño viable. A continuación, viaja a través de una rejilla de difracción. Allí, la luz se divide en bandas estrechas de luz de un solo color.
Compartimentos de muestraTienen cubetas, a menudo hechas de cuarzo para UV, vidrio para VIS o plástico, la longitud del camino, generalmente 1 cm, necesita permanecer la misma para comparaciones justas.
DetectoresLos fotodiodos y los tubos fotomultiplicadores convierten la luz pasada en señales eléctricas, el software que maneja las señales cambia esto en números de absorbancia o patrones de luz completa.
Requisitos previos a la operación y configuración del sistema
Antes de cualquier prueba, una buena configuración y comprobaciones se aseguran de que el espectrofotómetro da resultados sólidos. Esto cubre configuraciones mecánicas, basadas en luz y programas.
Calibración de instrumentos y corrección de referencia
Los controles son vitales para las lecturas verdaderas:
Precisión de la longitud de ondaComprobados con artículos de prueba aprobados como filtros de óxido de holmio, como otras herramientas, necesitan revisiones y pruebas constantes. Para los espectrofotómetros, las pruebas cubren la precisión fotométrica (rectitud de absorción), la precisión de la longitud de onda, el ancho de banda y la luz desviada.
Corrección de referenciaCorrige problemas de luz extravagante y sonidos de fondo. Hace esto escaneando un espacio en blanco, que es una cubeta con solo disolvente, a lo largo de la longitud de onda.
Selección y preparación de cubetas y muestras
La coincidencia de materiales importa mucho:
| región espectral | Tipo de cubeta | Notas |
|---|---|---|
| UV (< 300 nm) | Cuarzo | Alta transparencia |
| VIS ( > 320 nm) | Vidrio/plástico | Plástico no adecuado para UV |
Asegúrese de que las muestras sean claras y uniformes.
Mantenga las concentraciones en el área de absorbancia recta (0,2-1,0 UA).
Configuración del software y configuración del método
Los nuevos espectrofotómetros tienen formas basadas en programas para construir métodos: establecer detalles de escaneo incluye longitud de onda, velocidad de escaneo, ancho de hendidura, patrones de almacenamiento para mantener los métodos iguales en las pruebas.
Operación gradual del espectrofotómetro UV-VIS
Después de la configuración, un flujo claro paso a paso se asegura de que los datos lleguen correctamente. Va desde agregar muestras a los resultados de lectura.
Procedimientos de encendido y calentamiento
Comience con el arranque correcto de la máquina: Enciende la herramienta y deje que las lámparas se calienten, unos 20-30 minutos. Esto da estabilidad térmica. Los controles incorporados confirman la configuración, la resistencia de la lámpara y el trabajo del detector.
Medición en blanco y cero del instrumento
Un líquido en blanco, con solo disolvente, se mide primero. Establece el punto de partida de la absorbancia en cada longitud de onda. Siempre ponga las cubetas de la misma manera. Esto evita problemas de curvatura de luz.
Protocolos de medición de muestras
La forma en que mides depende de lo que quieras encontrar. Diferentes modos se ajustan a diferentes necesidades.
Modo de análisis de longitud de onda única
Este modo se adapta principalmente a las comprobaciones basadas en números: ajuste de la herramienta al analito’ s λmax y leer la muestra’ Absorbencia. Luego, empareje con una línea de calibración.
Modo de escaneo de espectro completo
Esto funciona mejor para estudios básicos: capturar todo el patrón de absorbancia, digamos 200-800 nm, detectar picos para verificar qué es el analito o encontrar partes no deseadas.
Operación en modo cinético (si es aplicable)
Para observar las reacciones: bloquear la longitud de onda a λmax, tomar lecturas de absorbancia en intervalos de tiempo. Esto muestra las velocidades de reacción.
Técnicas de procesamiento e interpretación de datos
Después de las lecturas, el análisis extrae datos útiles de la información de absorbancia.
Construcción de curvas de calibración para el análisis cuantitativo
Los pasos son hacer líquidos estándar en cantidades conocidas, tomando sus lecturas de absorbancia, dibujando un gráfico de absorbancia contra concentración y usando matemáticas en línea recta para obtener la fórmula de calibración.
Análisis espectral para información cualitativa
Mira las formas, tamaños y manchas de picos: picos claros, incluso a menudo significan que la muestra es pura, prueba métodos derivados para ordenar picos que se superponen en configuraciones mixtas.
Exportación, ahorro e informes de resultados
La máquina’ s programa le permite enviar datos en muchos formularios CSV para programas de tabla, PDF para informes, formularios especiales para comprobaciones posteriores y enlaces LIMS para seguimiento y revisiones.
Protocolos de mantenimiento y pautas de solución de problemas
Para un buen trabajo duradero, la atención regular y las reparaciones rápidas mantienen las cosas funcionando bien.
Prácticas de mantenimiento rutinario
Los trabajos incluyen intercambiar lámparas de deuterio / tungsteno en función del tiempo de uso, limpiar cubetas, manchas de muestra y caminos de luz a menudo, se requieren controles, controles de calidad, pruebas de método y configuraciones. Esto proviene de buenas reglas de laboratorio o reglas establecidas por las leyes.
Solución de problemas comunes de rendimiento
Las razones pueden ser desigualdades de la lámpara, partes de luz sucia e interrupciones de energía.
Lecturas de longitud de onda inexactas
Esto a menudo proviene de monocromator fuera de línea y estándares de comprobación desgastados
Destacar Perseguir como fabricante de confianza en instrumentación analítica
PERSEE ha construido un fuerte nombre como uno de los principales fabricantes mundiales de herramientas de espectroscopia exacta. La empresa El enfoque en nuevas ideas muestra cómo mezclan tecnología ligera con programas de análisis inteligentes.
Visión general de la experiencia de PERSEE en soluciones de espectroscopia
Con años en la fabricación de herramientas de análisis, PERSEE ofrece espectrofotómetros resistentes y fáciles de usar. Estos se ajustan a las tareas diarias y las necesidades de investigación profunda.
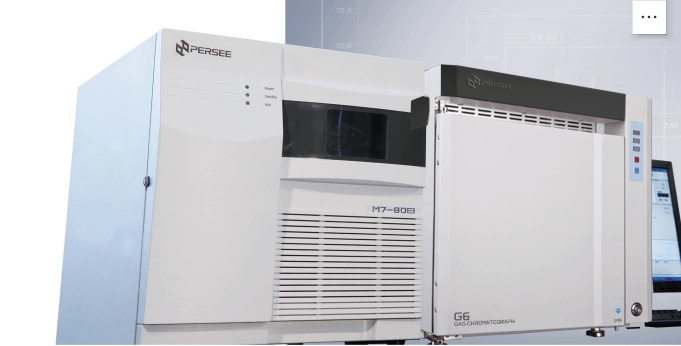
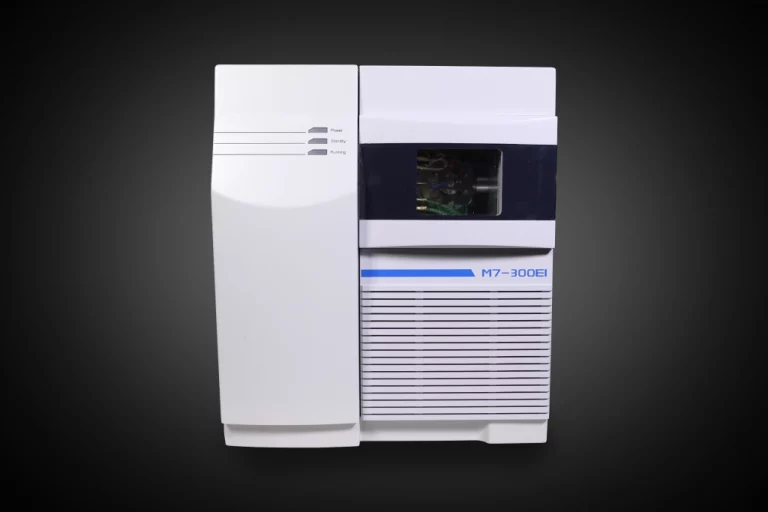
Modelos destacados: PERSEE M7 y G5 Series
Esto se adapta a tareas de alto detalle configuración de dos lámparas da una amplia cobertura de luz, estilo de dos hazes corta cambios de línea de base y corrige cambios en vivo.
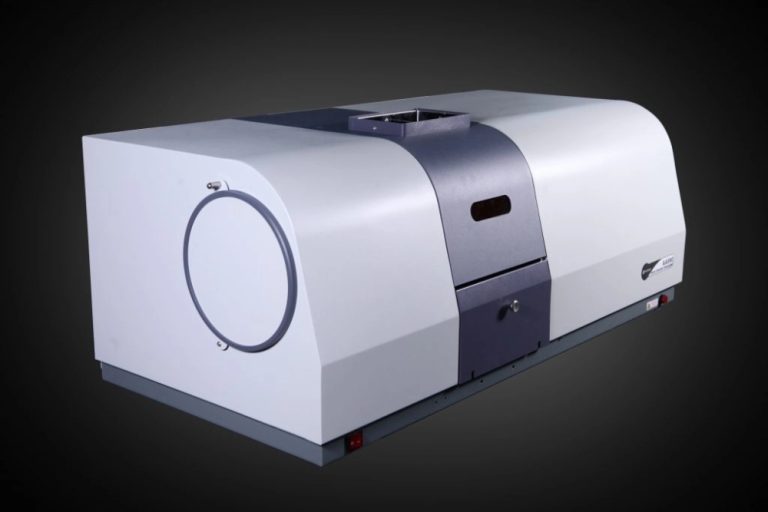
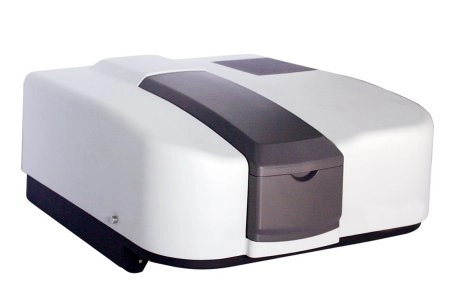
Serie G5GC Sistema UV-VIS
Diseñado para entornos de alto tráfico, el sistema proporciona procesamiento automatizado para muestras de alto volumen a través de un programa robusto y adaptable que cuenta con extensas metodologías configurables.
Consideraciones operacionales clave
Los resultados verdaderos y repetidos dependen de pasos cuidadosos: Hacer las reparaciones de referencia correctamente, Elegir cubetas de ajuste para el área de luz, comprobar los métodos de vez en cuando con estándares aprobados, Mantener los datos buenos importa tanto: planificar cambios de lámparas, limpiar partes de luz regularmente, ejecutar pruebas del sistema antes de las lecturas clave
Preguntas frecuentes
Q1: ¿Cuál es el rango de absorbancia ideal para resultados cuantitativos precisos?
A1: El mejor área de absorbancia está entre 0,2-1,0 UA. Valores más allá de esto pueden traer curvas o señales completas.
Q2: ¿Puedo usar cubetas de plástico para mediciones en la región UV?
A2: Las cubetas de plástico generalmente no funcionan por debajo de 300 nm. carecen de una buena claridad UV. Usar cubetas de cuarzo para el trabajo UV.
Q3: ¿Con qué frecuencia debo recalibrar mi espectrofotómetro?
A3: Revisar mensualmente durante el uso regular. Hazlo más si las pruebas clave están llegando.