As labs shift toward precise data handling and automated processes, picking the appropriate spectrophotometer turns into a smart choice for the future. John Barron explains that a spectrophotometer appears in nearly every chemical, biological, or life science lab. He notes that these tools vary from basic single-beam devices all the way to dual-beam or even intricate, often highly automated setups. No matter their level of complexity, every spectrophotometric device relies on the core ideas of the Beer–Lambert law. This basic rule stays vital when you check key performance aspects like spectral range, resolution, and detector technology.
Evaluating Spectral Range and Resolution
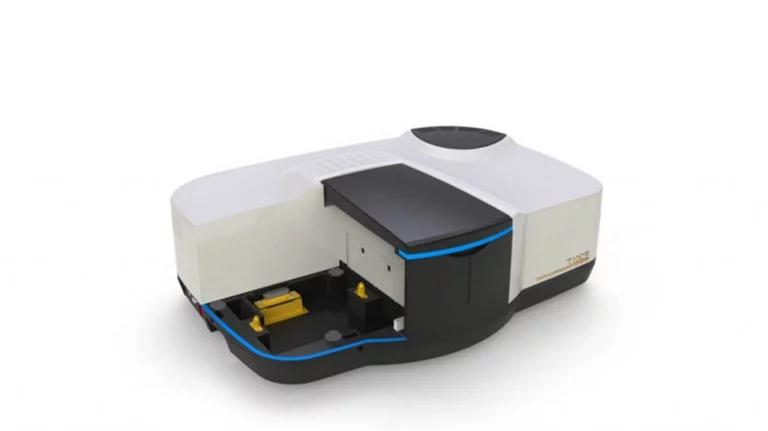
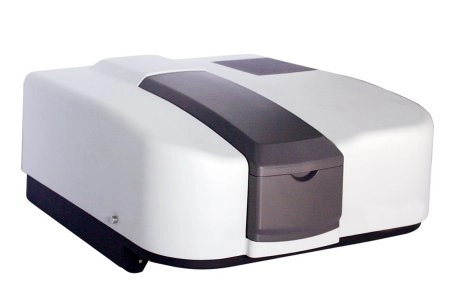
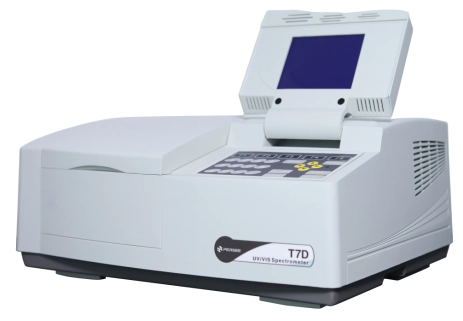
The spectral range sets the wavelengths where a tool can gauge absorbance or transmittance. These instruments handle visible light or ultraviolet light, reaching down to roughly 190 nm. In today’s analytical labs that deal with pharmaceutical checks or environmental tracking, a wide spectral range from UV to near-IR proves essential for flexibility. Devices such as the T7D UV-VIS offer adjustable spectral bandwidths along with fast scanning features, which allow for dependable photometric readings in various uses.
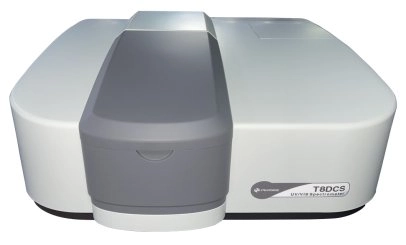
Resolution shows how clearly an instrument can separate nearby spectral details. Better resolution boosts accuracy in measuring amounts, though it might extend the time needed for data collection. The T8DCS UV-Vis model shows a good mix here, with its bandwidth that you can select continuously from 0.1–5 nm and a Czerny–Turner monochromator designed to cut down stray light while keeping strong optical clarity.
Considering the Light Source Type
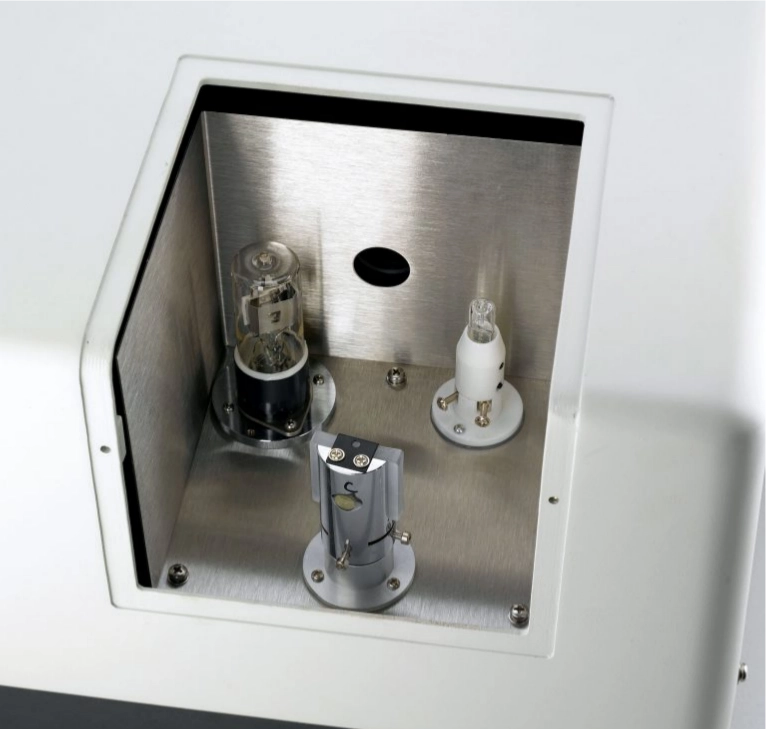
Your pick of light source impacts measurement steadiness and how long it lasts. Light from a wide-spectrum source, like deuterium (D₂) or tungsten (W), passes through the sample being tested and then focuses via the entry slit of a monochromator. Deuterium lamps give steady UV output. Meanwhile, tungsten halogen lamps work best for visible spectra. Numerous advanced setups combine both sources to cover the full range. Take the T6U UV-Vis, for example; it employs deuterium and tungsten lamps to provide top-notch stability over the entire wavelength span, which means reliable results with little variation as time goes on. LED-based sources are gaining ground as options with extended working life, but they cover narrower spectral areas, making them fit for everyday quality checks rather than detailed research work.
Assessing Detector Technology
The detector you choose affects how sensitive and quick the responses are. Standard single photodiode detectors perform well in targeted measurements, yet they take longer during scans. Photodiode array (PDA) detectors grab full spectra at the same time, which greatly speeds up work for studies on reactions over time or analysis of multiple parts. Barron’s research points out that fine-tuning aspects like linearity, wavelength accuracy, bandwidth, and stray light builds trust in the measurement results; these factors tie directly to detector performance and calibration benchmarks.
Advanced Features to Look for in 2026 Spectrophotometers
Since labs are adopting digital changes, the upcoming spectrophotometers need to fit smoothly into linked workflows, and they should support automation along with rules for compliance.
Integration with Laboratory Information Management Systems (LIMS)
Linking with LIMS makes data movement between tools and main databases easier. As a result, this cuts down on errors from manual entry, improves tracking, and speeds up report creation, all of which matter a lot in areas regulated by GMP. When a device works well with current lab programs, outcomes from units like the TU600 UV-Vis can move right into standard formats ready for audits.
Automation Capabilities and User Interface Design
Automation eases the hands-on effort and boosts repeatability in repeated tests. The T7 series highlights this approach with its strong automation level, where users just press keys twice for standard sample measurements. User-friendly interfaces, including touchscreen options or software run on PCs, make handling easier, even for tough jobs like quantifying DNA or proteins, or tracking reactions. A comfortable design paired with add-on modules lets researchers adjust setups fast without losing precision.
Comparing Different Types of Spectrophotometers
Choosing between UV-Vis and FTIR spectrophotometers hinges on what you aim to analyze, such as figuring out concentrations through absorbance or spotting molecular structures via vibration patterns.
UV-Vis Spectrophotometers: Applications and Benefits
UV-Vis tools stay essential in chemical testing, food safety checks, environmental monitoring, and life science studies. Each chemical absorbs, passes, or bounces light within certain wavelength bands. Thus, gauging absorbance at key wavelengths allows for both basic identification and exact amount calculations based on Beer–Lambert ideas. Units like the Tu500 UV-VIS deliver solid baseline steadiness, which suits school labs as well as factory quality programs, thanks to their sturdy optics and low stray light results.
FTIR Spectrophotometers: When to Choose Them?
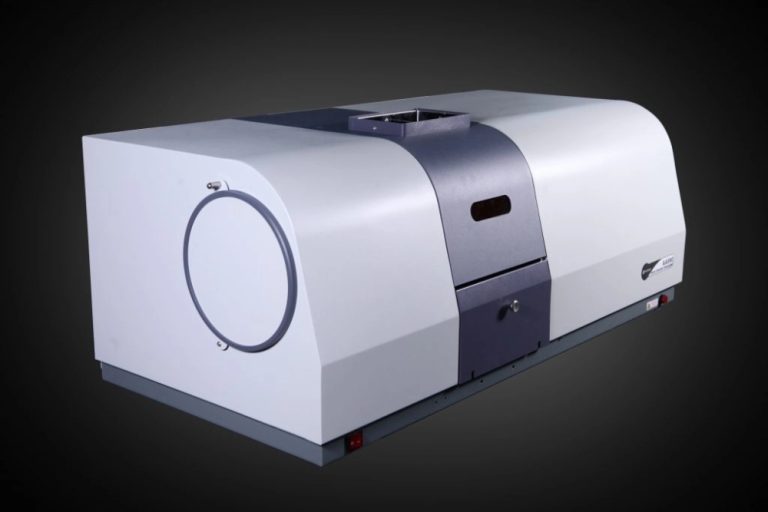
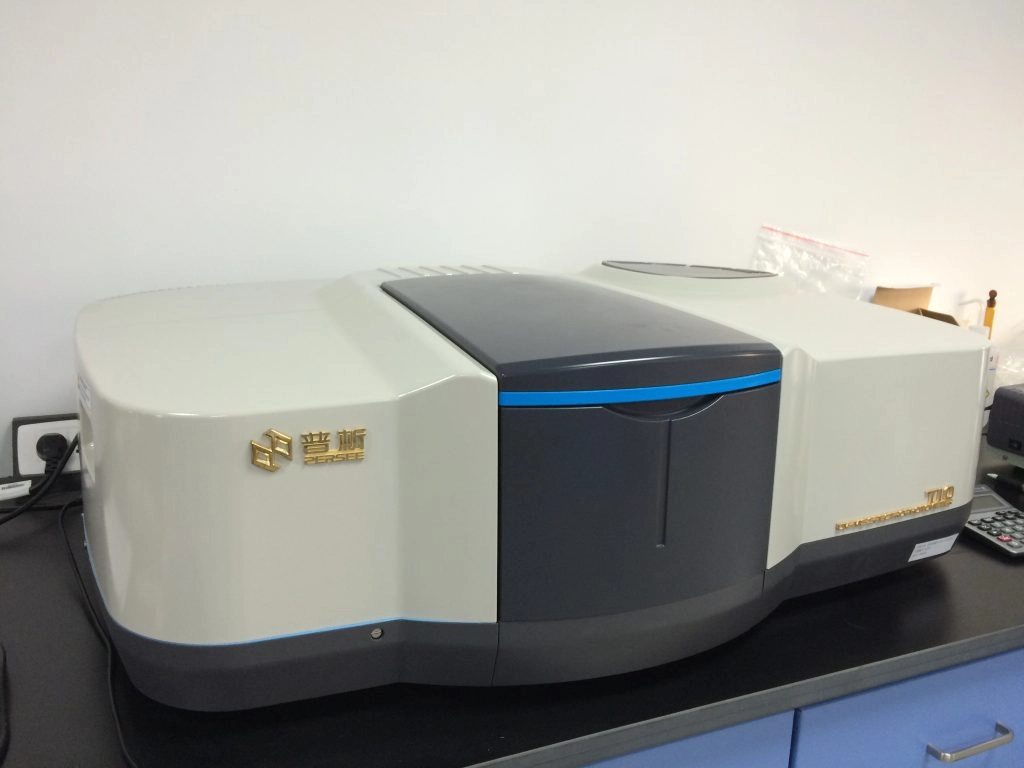
FTIR (Fourier Transform Infrared) spectrophotometers, such as the FTIR8000, push analysis into mid-infrared zones where molecules vibrate. These tools shine in examining polymers, checking pharmaceutical mixes, or finding contaminants, since they record full infrared spectra quickly with clear signal-to-noise levels. When you compare them to spread-out methods like UV-Vis, FTIR gives deeper details on structure, but it calls for more careful sample prep.
Budget Considerations and Cost-Efficiency Analysis
Though the starting price often leads buying talks, the full cost over time, covering upkeep schedule, supply expenses, calibration demands, and room for upgrades, decides the true worth in the long run.
Balancing Initial Cost with Long-Term Value
Tasks like calibration, quality checks, method approval, and setup verification are required, whether from solid lab practices or rules set by regulators. Tools that hold steady alignment shorten the need for frequent recalibration and lower running costs as years pass. For instance, many models come with pre-set deuterium/tungsten lamps that reduce stoppages during swaps while guaranteeing steady outcomes through their full service life.
Financing Options for Laboratory Equipment
Manufacturers now provide varied financing choices, such as lease deals, which let labs get cutting-edge gear without big initial outlays. Leasing offers ways to grow easily, perfect for places expecting quick expansion, whereas buying fully brings perks like claiming depreciation on assets.
PERSEE como fabricante confiable de instrumentos analíticos
Started in 1991 in Beijing’s Pinggu District, we stand as a current high-tech firm focused on research, development, and the making of scientific tools, all under ISO9001 quality controls. Beijing Purkinje General Instrument Co., Ltd., recognized worldwide as PERSEE, blends fresh research ideas with top manufacturing skills in areas like molecular spectroscopy, atomic spectroscopy, chromatography setups, and X-ray items. Our goal centers on adding lasting benefits to society via secure analysis solutions that improve daily life by protecting the environment and ensuring product safety around the globe.
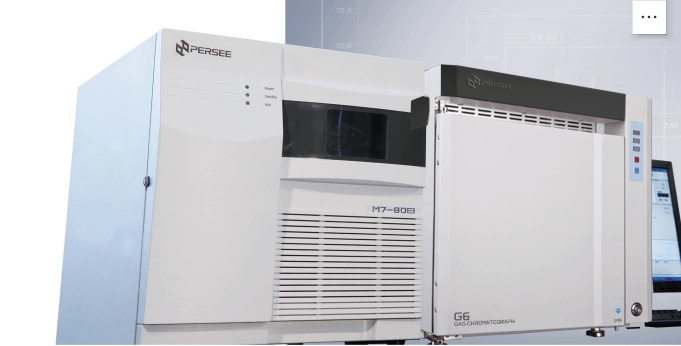
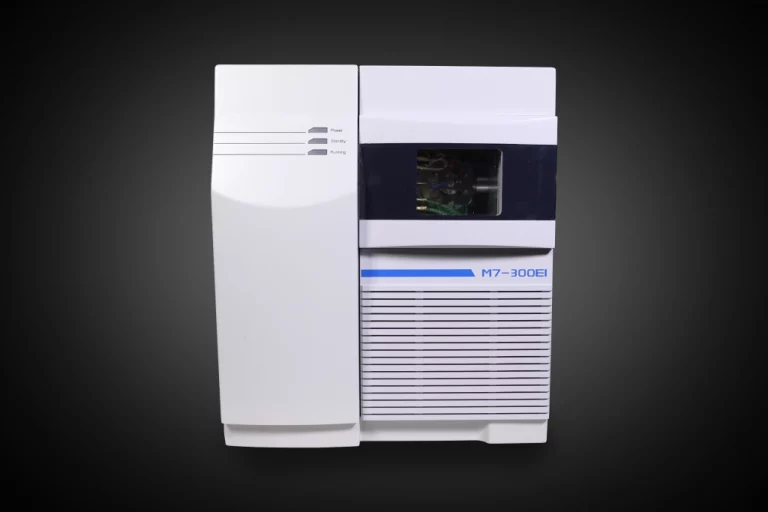
We craft every spectrophotometer, ranging from basic TU400 VIS types to sophisticated double-beam T10DCS UV-VIS units, to fit changing lab needs for exact measurements under rules like USP 857 and Ph. Eur standards. Our lineup also covers chromatography systems, including the M7 Single Quadrupole GC-MS, built for food safety tests and environmental care, due to its trustworthy ionization power. Those looking for full technical details can visit our main website at Perseguir.
Conclusión
When you select a spectrophotometer ready for labs of the future, keep these points in mind. Focus on broad spectral coverage (UV–VIS–NIR) paired with bandwidths you can adjust. Check dual-source lighting that mixes deuterium/tungsten for steady performance. Pick high-resolution detectors that keep linearity during calibration under official guidelines. Look for designs friendly to automation and linked with LIMS for smooth connections. Weigh the spending against how durable it lasts over time, not just the starting price. Team up with manufacturers who supply worldwide tech help supported by proven production quality.
By matching these elements, you secure reliable analysis work in fields from pharmaceuticals to environmental studies, and this sets labs up strongly in digital research settings where exactness builds trust. For in-depth advice on adding our newest spectroscopic tech into your lab’s setup or setting up custom demos for your specific area, reach out to us via our expert team through the contact paths on our site.
Preguntas frecuentes
Q1: What are the main differences between a single-beam and a double-beam spectrophotometer?
A1: Single-beam types handle one sample at a time, using step-by-step reference checks; double-beam ones divide the light so the reference and sample get measured together, which improves baseline steadiness over extended scans.
Q2: ¿Con qué frecuencia debe calibrarse un espectrofotómetro?
A2: You should calibrate every six months or follow the manufacturer’s advice, because steady checks make sure wavelength precision stays within limits set by global pharmacopoeia rules.
Q3: Can spectrophotometers be used for both qualitative and quantitative analysis?
A3: Absolutely; for qualitative work, you use unique absorption peaks to identify, while quantitative work applies Beer–Lambert links between absorbance strength and substance levels, turning today’s spectrophotometers into flexible aids across science fields.