Spectrophotometers are vital tools in today’s analytical chemistry. They offer quantitative analysis in many scientific fields. As an analytical tool, a spectrophotometer appears in nearly every chemical, biological, or life science lab. The device can vary in design from a basic single-beam unit to dual-beam types or even complex, highly automated ones. These tools depend on the Beer–Lambert law. They measure light absorbance at certain wavelengths to find analyte concentrations. Like other equipment, they need regular checks and validation to some degree, and their uses go beyond chemistry. They reach into areas like environmental testing, pharmaceuticals, food safety, and materials science.
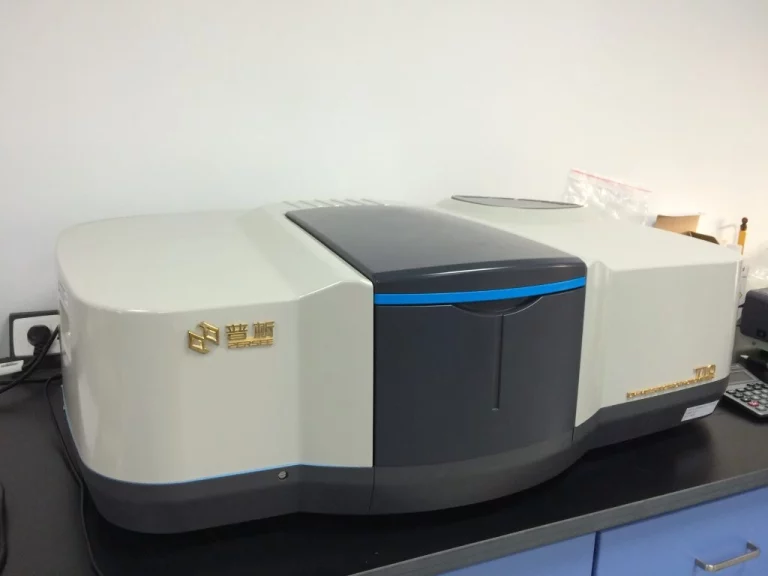
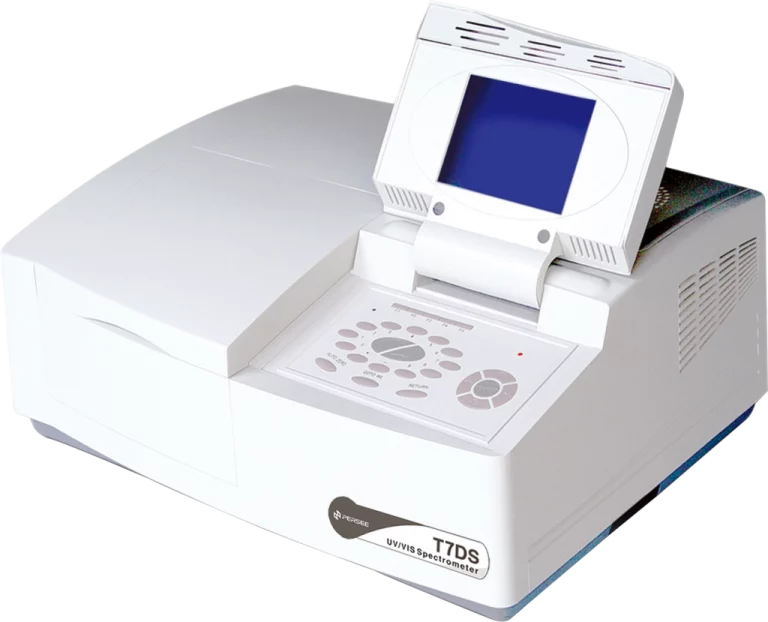
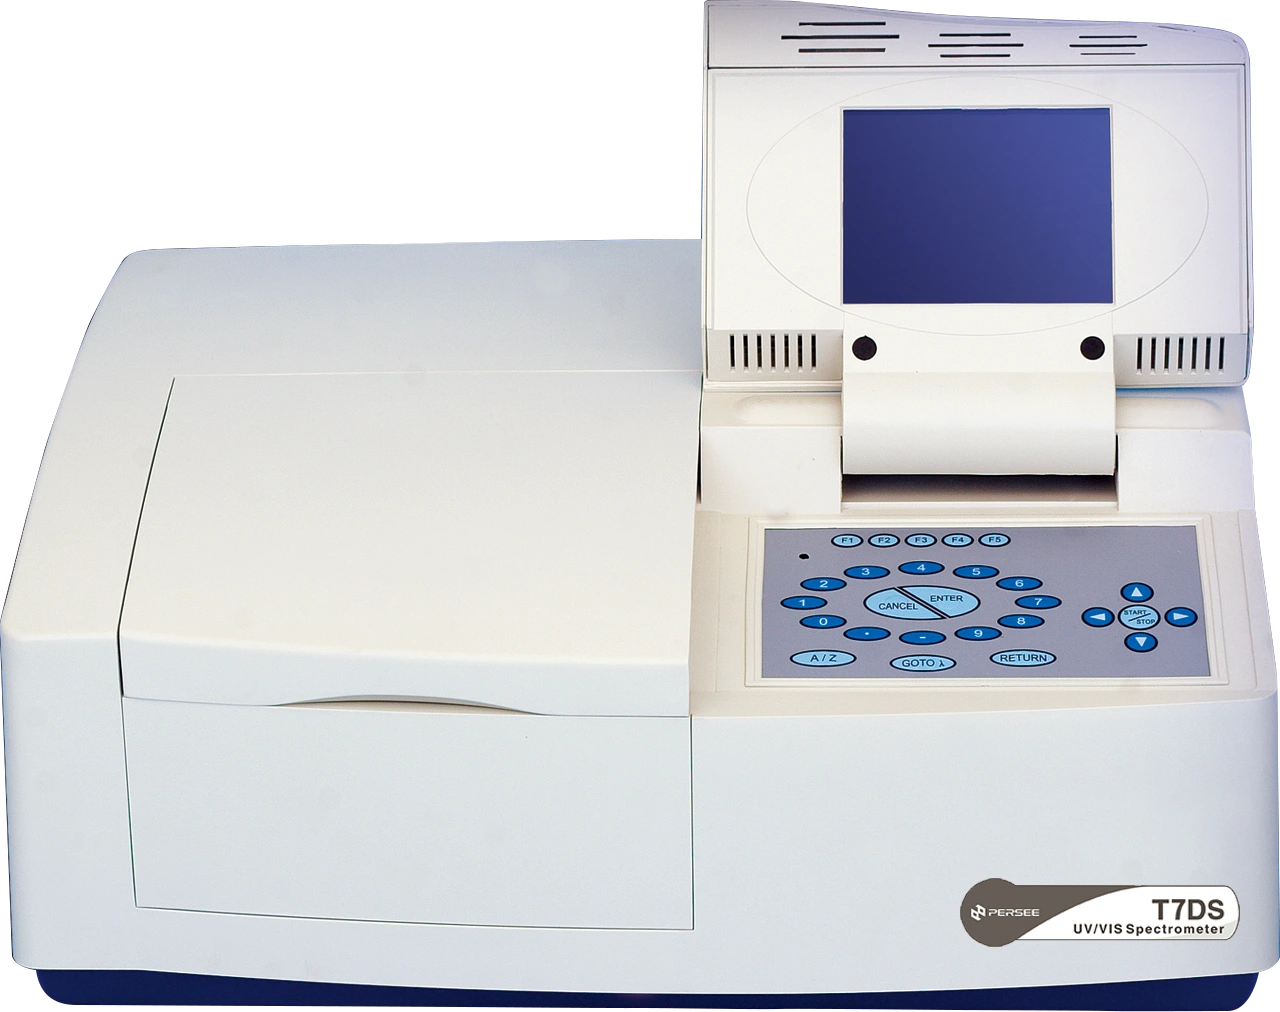
In fields that require exactness and repeatability, spectrophotometers act as key tools for quality control, and they also help meet regulatory standards. For example, UV-Vis spectrophotometers are often used in environmental monitoring and pharmaceutical research, and they provide quick and dependable results. The T7D/T7DS can handle photometric measurements, spectrum scans, quantitative determinations, and DNA/Protein analysis. Yet, even top systems can face working errors, and these issues can harm accuracy if maintenance lacks proper care.
What Causes Calibration Issues in Spectrophotometers?
Calibration errors rank as one of the main reasons for wrong readings in spectrophotometry. These problems usually come from wrong wavelength settings or physical shifts in the optical setup. The key parameters for testing spectrophotometers include photometric accuracy (absorbance linearity), wavelength accuracy, bandwidth, and stray light. When these values stray from what is expected due to mechanical shifts or poor setup, the trust in analytical results drops a lot, and this happens because the reliability suffers greatly from such deviations.
Optical misalignment might develop from normal wear over periods or rough handling in upkeep tasks. Wrong wavelength calibration can also stem from worn-out reference standards or errors in software setup. Since wavelength accuracy impacts absorbance measurements directly, even small shifts can cause major errors in quantity assessments. Therefore, addressing these early proves essential for solid outcomes.
Troubleshooting Calibration Problems
To bring back accuracy, analysts ought to do regular checks with a certified calibration standard, and these standards must follow metrological traceability rules. They come from top-quality chemicals that receive full characterization. Moreover, they adhere to metrological rules like traceability, measurement uncertainty, accuracy, specification, stability, precision, and safety. Scheduled calibrations help keep performance steady. Daily ones suit high-volume labs, while weekly checks work for routine use, and this approach ensures ongoing reliability.
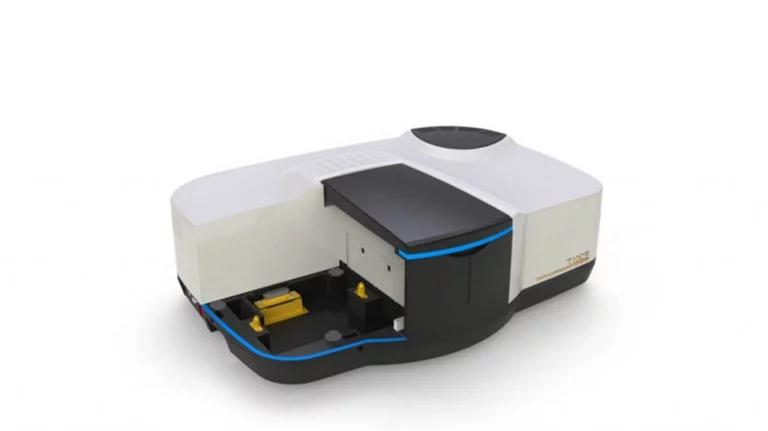
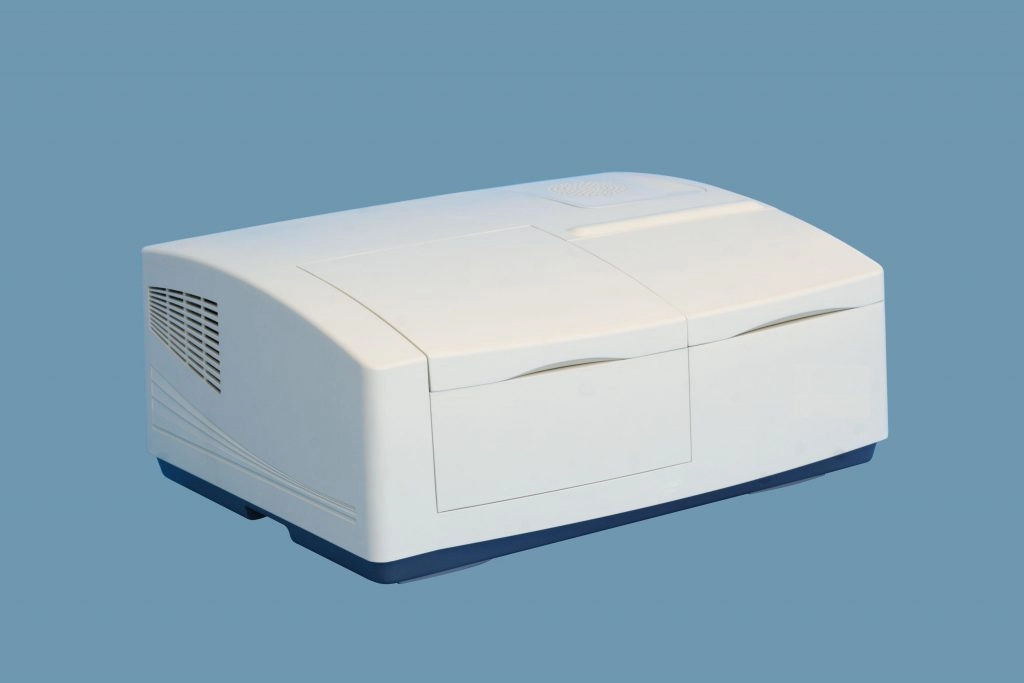
Our group suggests choosing spectrophotometers with self-calibration options. For instance, the T7 uv-vis uses holographic blazed gratings and split-beam optics. These features boost wavelength stability. The setup cuts down on manual work. At the same time, it upholds accuracy over long periods.
How Do Sample Preparation Mistakes Affect Results?
Sample preparation stands out as a vital step in spectrophotometric analysis. Mistakes here can ruin even the best instrument calibrations. Typical problems involve uneven sample concentrations, changes in path length from bad cuvette filling, and dirt from old samples or dirty holders. Such issues directly undermine the process, and they lead to flawed data despite careful instrument setup.
Contamination might start from leftover chemicals on glassware. Or it could arise from mixing samples during pipetting. Bubbles from stirring can also scatter light in the cuvette, which distorts absorbance readings and affects overall results.
Solutions for Sample Preparation Errors
To address these issues, labs should use standard sample prep methods, and they must pair this with strict cleaning steps. Fresh reagents help a lot. Cuvettes need to stay free of prints or leftovers for good repeatability. Systems like the TU600 UV-VIS make tasks easier, and they offer steady sample handling that lowers changes from user actions. Plus, quality checks like blank runs before each test catch dirt early. Keeping the sample volume and strength steady supports the linearity in the Beer–Lambert law rules. Thus, results become more consistent and trustworthy.
Why Does Instrumental Drift Occur Over Time?
Instrumental drift means slow shifts in measurement outputs, and these changes do not relate to real sample traits. Temperature changes often cause this. Shifts in room conditions affect detector response and light source power. Such temperature effects hit instrument steadiness, and they change baseline absorbance values as time passes. Old electronic parts add to the problem, too. They modify voltage outputs in photodetectors or amplifiers. Without regular recalibration or part swaps on schedule, drift builds up. Soon, the results go beyond the allowed limits, which makes ongoing maintenance crucial for sustained performance.
Mitigating Instrumental Drift
A steady temperature setting in the lab keeps performance even during long runs. Tools with auto baseline fixes handle slow drops in lamp power or detector output. Regular upkeep, like swapping lamps at suggested times, lowers drift chances further.
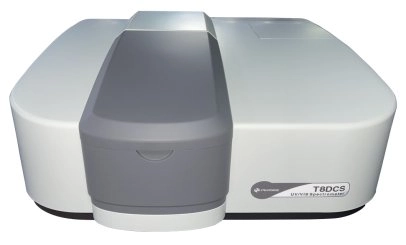
Top models such as T8DCS use real double-beam optics with photomultiplier detectors. These give great sensitivity, and they also cut noise across different spectral bandwidths. The design suits long-term exact needs well.
How Can Stray Light Interference Be Controlled?
Stray light includes any extra radiation that hits the detector. It does not come from the planned light path, which often happens when outside light enters weak seals. Or it results from bounces inside mirrors and gratings. Labs measure scattered light in two main ways. One uses cut-off filters that block part of the spectrum while letting another part through. The other employs monochromatic light from sources like atomic emissions or lasers.
Too much stray light causes wrong absorbance values, which falsely boost the transmitted intensity. This proves especially bad for samples that absorb a lot, near the detection edges. Hence, controlling it remains key for precise work.
Corrective Measures for Stray Light Interference
Good shields against outside light matter a great deal. Operate tools far from the sun or shiny spots. Keep the inside optical parts clean and lined up to avoid inner scattering. Newer builds use holographic gratings, and these drop stray light far below old ruled types. For example, T7D units pair holographic gratings with dual-beam optics. This setup ensures little interference at low transmittance, which shines in environmental pollutant checks where small amounts count most.
What Leads to Detector Saturation During Measurement?
Detector saturation takes place when the light strength goes beyond the detector’s linear response area, which leads to signal twists or flat lines at high absorbance levels. It commonly occurs with strong samples lacking dilution. Or it happens with wrong path lengths that raise the energy too much for the detector. Bright sources can overload photodiodes, which results in curved response lines. As a result, tiny concentration shifts look much bigger in spectra. Proper management prevents these distortions effectively.
Addressing Detector Saturation Problems
To stop saturation effects, dilute samples so that absorbances stay in the 0–2 Abs range, which matches the best linear area from Beer–Lambert law. Or adjust path lengths shorter as needed. Neutral density filters cut extra radiation before detection, and they do this without changing the spectrum. Modern spectrophotometers have dynamic gain controls, and these adjust in real time for different strengths. They keep linearity over wide concentration spans, which fits pharmaceutical tests that need both care and strength.
Why Is PERSEE Considered a Reliable Manufacturer of Analytical Instruments?
We feel proud as a current high-tech firm focused on research, development, making, and selling scientific tools since 1991. Our goal goes past just building products. We seek to improve worldwide analytical skills through fresh tech certified by ISO9001 quality systems and CE standards (Beijing Purkinje General Instrument Co., Ltd. is a modern high-tech enterprise that was founded in 1991).
Our lineup covers molecular spectrometers from TU400 Vis to T10DCS UV-VIS models. These suit labs need high exactness in places like schools, environmental groups, food check centers, farm research spots, oil-chemical firms, and drug labs (PERSEE instruments play a crucial role in conducting experiments, providing precise measurements, enabling manufacturers to meet regulatory requirements). Each tool, from basic T6u uv-vis with its low stray light build to top double-beam setups, shows our focus on dependability and fair prices. We back this with helpful support teams around the world.
We keep pushing new tech like holographic gratings that lessen stray light problems and auto cell changers that speed up work. All these links smoothly work with our UV-Win software. It supports GLP rules and handles data in many forms, vital for controlled settings (Electronic control and software enable this while maintaining features that are well established and accepted through the industry). For experts wanting strong tools that fit various analytical jobs—from school training to factory quality checks—we ask you to look at our full selection at Persee.
Kesimpulan
Spectrophotometer work relies heavily on careful calibration habits and steady operation steps. These tackle error sources like optical shifts or heat-caused drift (Calibration, quality control, method validation, and qualification are mandatory either from a good laboratory practice perspective or regulatory requirement). Set maintenance times with proven fix methods, keep measurement truth, and follow rules over the tool’s life.
By adding smart engineering to our builds—from steady dual-beam setups that cut noise to smart self-check parts that shorten stoppages—we make sure every lab gets even analytical success. Our support networks stand ready through online contact ways whenever help arises.
FAQ (Pertanyaan umum)
Q1: What is the most common cause of spectrophotometer errors?
A1: The most frequent cause lies in improper calibration settings, leading to inaccurate wavelength alignment; periodic verification using certified standards prevents such deviations effectively.
Q2: How can I prevent sample contamination in spectrophotometry?
A2: Ensure all containers and cuvettes undergo thorough cleaning before use; adopt standardized preparation protocols, including blank checks between runs, to eliminate carryover contamination risks.
Q3: Why is it important to control temperature during spectrophotometric analysis?
A3: Temperature fluctuations induce instrumental drift affecting baseline stability; maintaining controlled ambient conditions guarantees reproducible results across extended measurement sessions while safeguarding component longevity.