La spettroscopia a infrarossi (IR) è uno strumento chiave nella chimica analitica. Aiuta a identificare e misurare le strutture molecolari dal modo in cui la luce infrarossa interagisce con i materiali. Questo metodo non provoca danni. Gli esperti lo usano molto negli studi e nelle fabbriche perché funziona bene e dà una visione chiara a livello molecolare.
Principi fondamentali della spettroscopia infrarossa
Lo spettro di una sostanza organica agisce come la sua impronta digitale. In teoria, non due sostanze diverse danno lo stesso spettro di assorbimento. Questa caratteristica consente agli spettri IR di funzionare come impronte digitali molecolari speciali. Di conseguenza, è possibile effettuare controlli sia qualitativi che quantitativi con spettrofotometria IR. Aiuta nella chiara determinazione della struttura.
Regioni spettrali e loro rilevanza analitica
La spettroscopia infrarossa copre tre aree spettrali principali. Infrarossi vicini (NIR): 0,78-2,5 µm. Infrarosso medio (MIR): 2,5-25 µm. Infrarossi lontani (FIR): 25-1000 µm. Ogni area ha i suoi usi in analisi. La spettroscopia NIR trova uso nella raffinazione del petrolio. Adatta bene a prodotti petrochimici e polimeri. Tuttavia, la regione infrarossa media è la più importante per il controllo dei composti organici. Include le modalità vibrazionali di base dei legami come C = O, N-H e O-H. La scelta della finestra spettrale si basa sui tratti del campione. Questi includono la complessità della matrice, lo stato fisico e la composizione molecolare. Così, garantisce una buona raccolta dei dati per una solida interpretazione.
Componenti e funzionalità di uno spettrometro a infrarossi
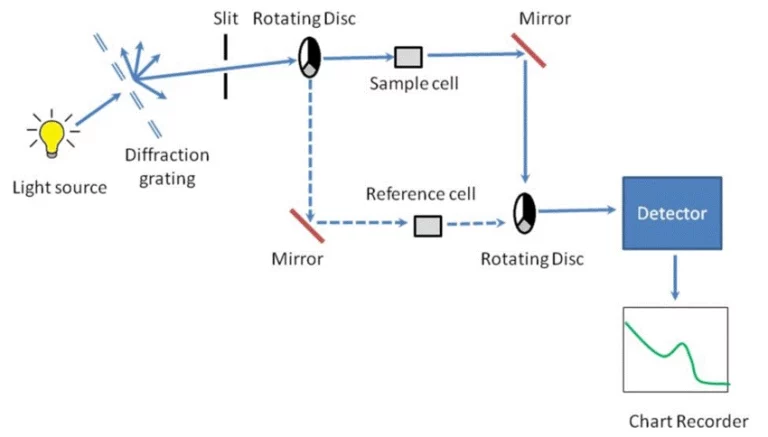
Un attuale spettrometro infrarosso combina ottica, elettronica e sistemi software in modo intelligente. Si propone di creare letture spettrali esatte.
Elementi di strumentazione di base
Fonti infrarosseLe fonti abituali sono il Globar (carburo di silicio) e il Nernst (ossidi di terre rare). Offrono una radiazione costante su ampie aree IR.
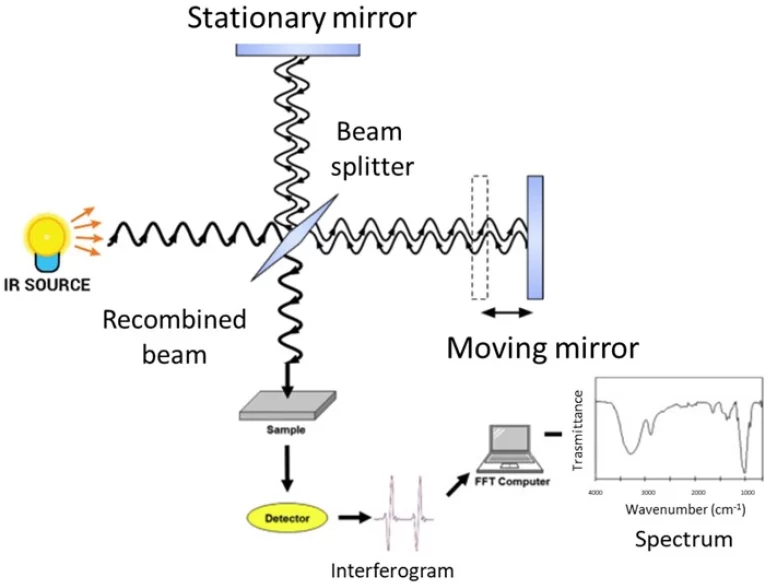
Splitter di fascio e interferometriNelli spettrometri infrarossi a trasformazione di Fourier (FTIR), un interferometro Michelson divide e unisce i fasci. Fai un interferogramma. Si tratta di un segnale modificato che conserva tutti i dettagli spettrali.
RilevatoriDue rilevatori comuni sono DTGS (Deuterated Triglycine Sulfate). Funziona a temperatura ambiente e rimane stabile. Un altro è MCT (Tellururo di Cadmio Mercurio). Ha una forte sensibilità e una risposta rapida. Ma ha bisogno di raffreddamento.
Tecniche di manipolazione dei campioni in spettroscopia IR
La giusta configurazione del campione assicura che la luce IR tocchi bene l'analito.
campionamento modalità trasmissione
Questo vecchio metodo invia le radiazioni IR direttamente attraverso un film sottile o un campione pressato. Per i solidi, i pellet di bromuro di potassio (KBr) funzionano spesso. Lasciano passare chiaramente la luce IR. Per i liquidi, le cellule con finestre di cloruro di sodio o fluoruro di calcio sono comuni.
Tecnica di riflessione totale attenuata (ATR)
ATR rende il campionamento più facile. Salta passi di preparazione difficili. ATR facilita la preparazione del campione permettendo la misurazione diretta senza diluire o premere. Questo metodo brilla per liquidi o solidi spessi. Si concentra sulla superficie.
Riflessione diffusa (DRIFTS) e riflessione speculare
Questi metodi ampliano i controlli IR a polveri o campioni grezzi. DRIFTS cattura la luce dispersa dalle polveri fine. La riflessione speculare controlla le superfici lucide. Entrambi aggiungono opzioni per le forme di campione.
Acquisizione dati e interpretazione spettrale

Trasformare gli interferogrammi grezzi in spettri chiari richiede una forte elaborazione matematica. Richiede anche una buona conoscenza dei modelli spettrali.
Processamento dei segnali e algoritmi di trasformazione di Fourier
Gli spettrometri FTIR utilizzano la trasformazione di Fourier per cambiare gli interferogrammi in spettri normali. I principali passaggi di elaborazione sono questi. Apodizzazione: liscia l'interferogramma per tagliare i lobi laterali spettrali. Zero-filling: aumenta la risoluzione digitale aggiungendo punti di dati. Correzione di fase: allinea i picchi spettrali a destra. Tali passaggi aumentano la risoluzione, la nitidezza massima e la qualità dei dati. Assegnazione del picco e identificazione del gruppo funzionale
Ogni banda di assorbimento si collega a determinati spostamenti vibrazionali legati a legami chimici.
Ad esempio:
| Gruppo Funzionale | Tipico intervallo di assorbimento IR |
|---|---|
| O–H (alcoli) | 3200-3550 cm ⁻¹ |
| C=O (carbonile) | 1650-1750 cm ⁻¹ |
| N-H (ammine) | 3300-3500 cm ⁻¹ |
Le librerie spettrali aiutano a corrispondere agli elementi noti per il rilevamento composto. Con lo spettro IR unico delle sostanze, è possibile effettuare controlli qualitativi e quantitativi tramite spettrofotometria IR.
Migliorare l'accuratezza della caratterizzazione molecolare con la tecnologia FTIR
Oggi’ Gli strumenti FTIR offrono alta precisione grazie a nuove idee in ottica, elettronica e software.
Risoluzione, sensibilità e ottimizzazione segnale-rumore
La risoluzione ottica determina quanto bene si individuino i picchi vicini. Importanti ad alta risoluzione per campioni misti o piccoli cambiamenti di struttura. Metodi come la media di diverse scansioni o l'uso di rilevatori raffreddati riducono il rumore. Quindi, rendono i segnali più chiari.
Capacità di analisi quantitativa dei sistemi FTIR
FTIR va oltre solo individuare le cose. Utilizzando modelli di taratura dalla legge di Beer-Lambert o metodi statistici come la Regressione dei Quadrati Minori Parziali (PLS), si ottengono controlli quantitativi esatti. Questo funziona anche in configurazioni miste. - Sì. - Sì. Con modelli di taratura basati sulla legge di Beer-Lambert o metodi multivariati come la regressione PLS, gli spettrometri infrarossi possono misurare con precisione le concentrazioni di determinati composti in miscele.
Applicazioni in diversi campi scientifici
La flessibilità degli spettrometri infrarossi li ha resi vitali in molte aree scientifiche.
Analisi dei composti organici e inorganici
La spettroscopia IR aiuta a individuare gruppi funzionali in polimeri artificiali, farmaci, prodotti chimici agricoli e altri. Trova anche vibrazioni metallo-ligando in configurazioni inorganiche per controlli della struttura. La spettroscopia è una tecnica analitica specifica utilizzata nella determinazione della struttura dei composti organici.
Monitoraggio in tempo reale dei processi industriali
Nelle fabbriche, gli strumenti IR si adattano alle impostazioni di Process Analytical Technology (PAT) per i controlli di qualità. Le aziende petrolifere utilizzano la spettrofotometria IR e la spettrofotometria Raman per il controllo della qualità dei prodotti online. I sensori FTIR in linea consentono di controllare il trucco in tempo reale durante la realizzazione.
Investigazioni ambientali e forensi
La spettrometria a infrarossi aiuta molto nella sicurezza ambientale e nel lavoro forense. La spettrofotometria a infrarossi è stata utilizzata in diverse aree delle scienze forensi. Detetta inquinanti nell'aria, nell'acqua o nel suolo. Controlla anche tracce come fibre, adesivi o inchiostri con piccoli strumenti di campionamento.
PERSEE: un produttore affidabile di spettrometri a infrarossi
Per il progresso della scienza, strumenti solidi sono fondamentali. Persee è diventato un nome mondiale nella produzione di dispositivi analitici avanzati.
Panoramica delle competenze tecnologiche di PERSEE
PERSEE è un fresco azienda high-tech iniziato nel 1991. Miscela R& D, fabbricazione e vendite sotto rigorose regole di qualità come le certificazioni ISO9001 e CE. Oltre il 30% del suo personale lavora in R& D. Perciò, PERSEE porta nuove risposte in settori come l'istruzione, gli studi sulle droghe, l'agricoltura, i controlli petrolchimici e l'osservazione ambientale.
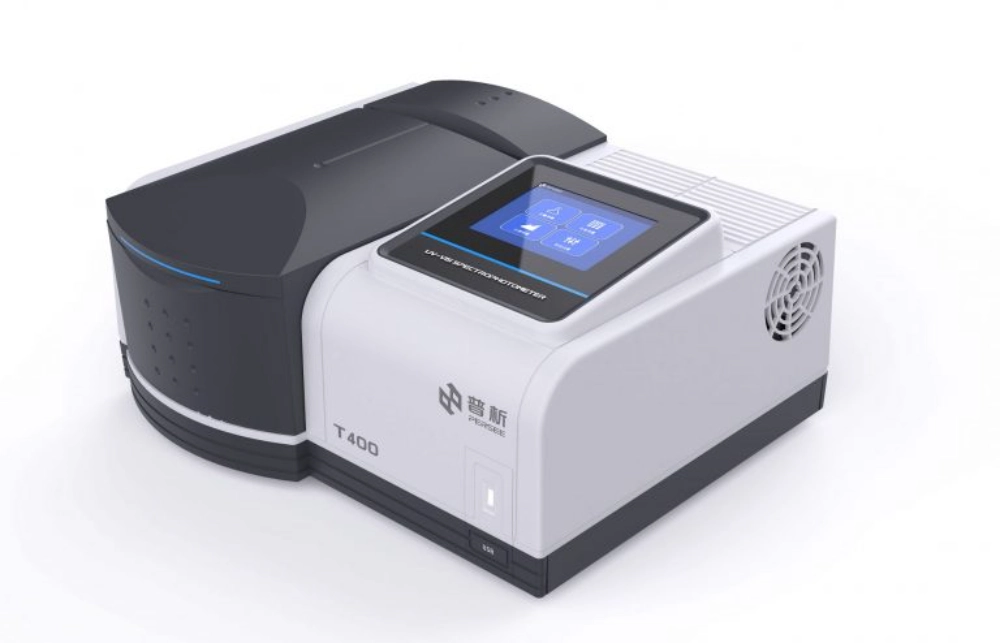
Prodotti chiave nel portafoglio di spettroscopia a infrarossi
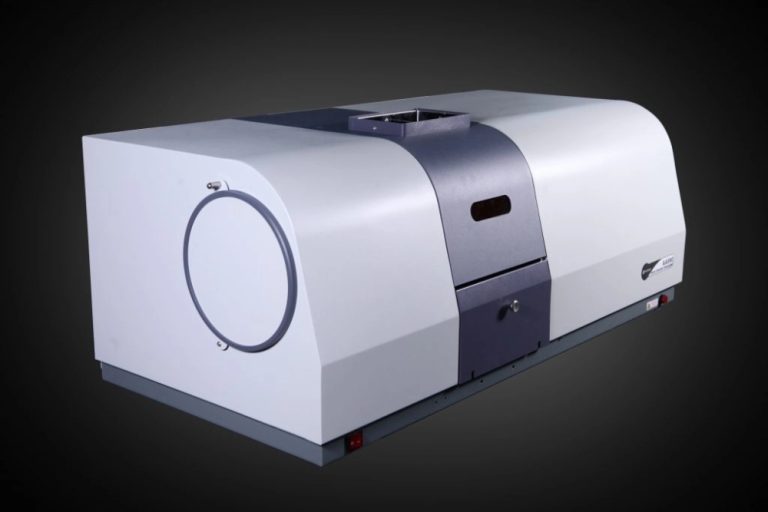
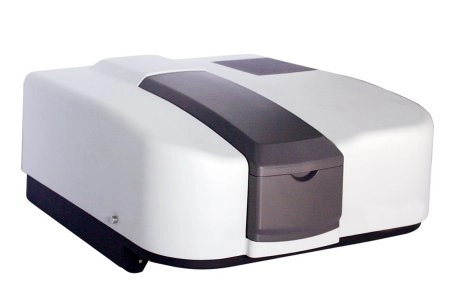
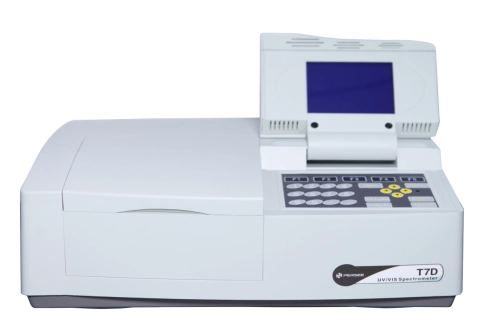
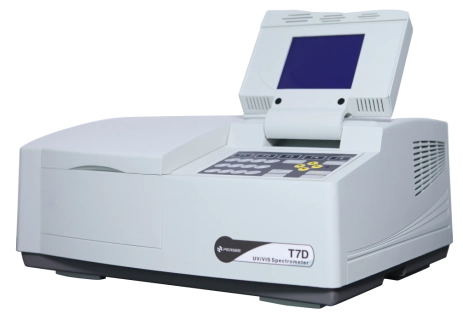
Caratteristiche e vantaggi della serie FTIR8000
FTIR8000 gli strumenti della serie offrono una forte risoluzione su un'ampia gamma spettrale. Queste unità desktop si adattano al lavoro quotidiano di laboratorio dove sono necessari controlli molecolari esatti.
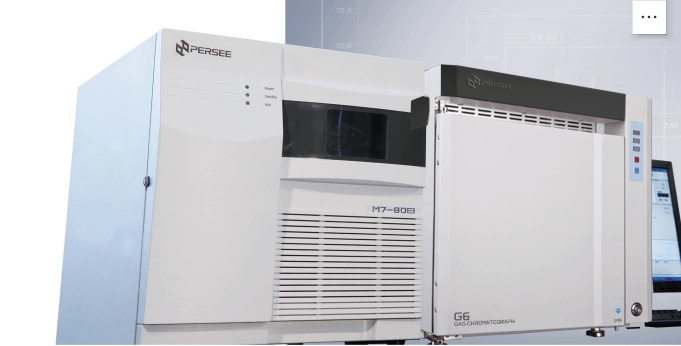
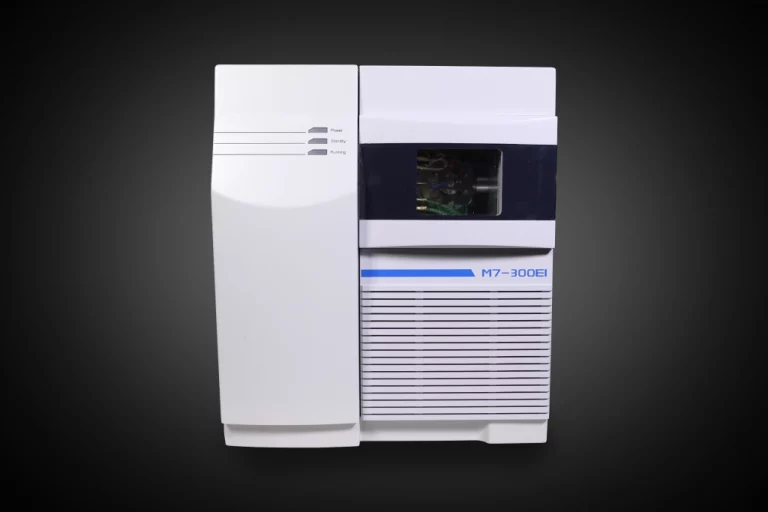
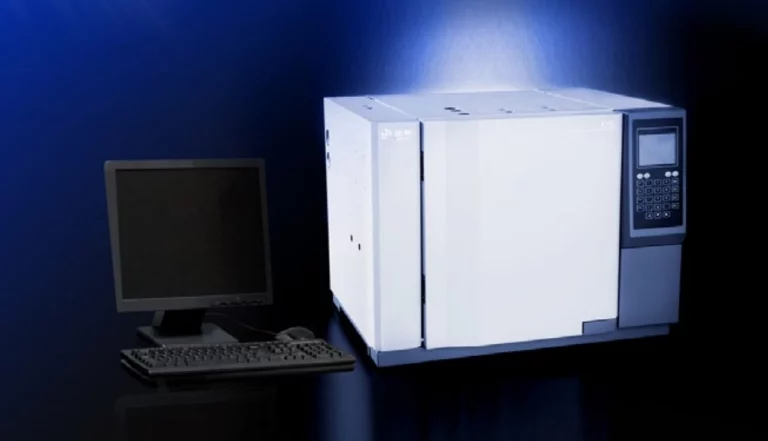
Punti salienti del sistema FTIR portatile M7
M7 Quadrupolo singolo GC-MS è lo spettrometro di massa ad alte prestazioni di nuova generazione progettato da Persee, che detiene esclusivamente i diritti di proprietà intellettuale. La sua piccola costruzione mantiene una forte potenza di analisi. Ciò lo rende buono per il lavoro sul campo e la ricerca rigorosa. Il MS M7 potrebbe essere ampiamente utilizzato nella sicurezza alimentare, nella protezione dell'ambiente, nell'industria chimica dei materiali, nelle scienze della vita, nella ricerca medica, nelle indagini penali e in molti altri campi. Ha parti speciali come fonti EI a doppio filamento e pompe molecolari turbo ad alta efficienza dalla Germania’ s Pfeiffer Vacuum per lavori solidi.
Il ruolo degli spettrometri infrarossi nell'analisi molecolare
Gli spettrometri infrarossi rimangono strumenti indispensabili per gli scienziati che vogliono conoscenze approfondite sulle molecole. Attraverso parti ottiche intelligenti come interferometri e rilevatori taglienti come MCT o cristalli DTGS. Inoltre, diverse modalità di campionamento tra cui ATR e DRIFTS. Gli strumenti IR moderni consentono il rilevamento qualitativo completo e forti controlli quantitativi. La tecnologia FTIR aumenta la risoluzione e la fiducia in configurazioni difficili.
Domande frequenti
Q1.Qual è la differenza tra spettroscopia IR dispersiva e FTIR?
A1: Dispersive IR utilizza un monocromatore per scansionare singole lunghezze d'onda in sequenza, mentre FTIR raccoglie tutte le lunghezze d'onda contemporaneamente utilizzando un interferometro. FTIR offre acquisizione dati più veloce, rapporto segnale-rumore più alto e una migliore risoluzione spettrale.
Q2. Gli spettrometri infrarossi possono essere utilizzati per l'analisi quantitativa?
A2: Sì. Utilizzando modelli di taratura basati sulla legge di Beer-Lambert o metodi multivariati come la regressione PLS, gli spettrometri infrarossi possono quantificare con precisione le concentrazioni di composti specifici all'interno di miscele.
Q3. Come il campionamento ATR migliora l'usabilità nella spettroscopia a infrarossi?
A3:ATR semplifica la preparazione del campione consentendo la misurazione diretta senza diluizione o formazione di pellet. È particolarmente utile per solidi o liquidi viscosi a causa della sua minima profondità di penetrazione nella superficie del campione.