分光光度法は化学物質の吸収または透過の光量を測定する基本技術である。このような状況は、ビームが議論された材料を含む溶液を通過し、次に反対側から放出される光の強度を評価するときに発生する。全体を紫外可視分光光度計に設定することで、基礎を築きました。これらのツールは紫外線と可視光の範囲内の吸光度を評価する。ビル・ランベルトの法則は、吸光度、濃度、光路長の間の直接的なつながりを指摘している。そのため、科学者たちは分析物の濃度を正確に計算することができる。材料の吸光度または透過特性を観察することにより、溶液中の分析物の濃度を算出することができる。これらの特徴は波長によって変化します。これらのツールは化学、生物学、環境科学などの分野の定量的な仕事にとって極めて重要であることが実証された。彼らの強みは、安定した正確性と再現可能な結果にある。
UV-Visスペクトロフォトメーターのアプリケーション
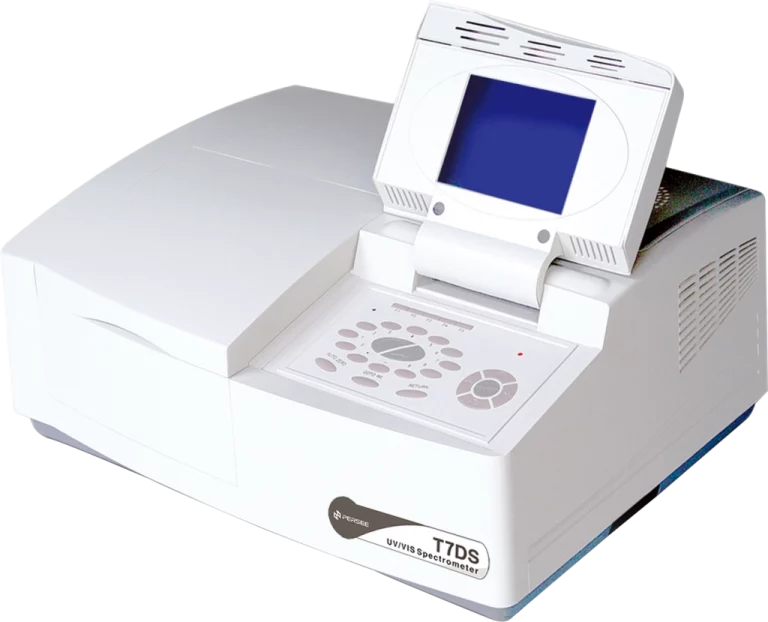
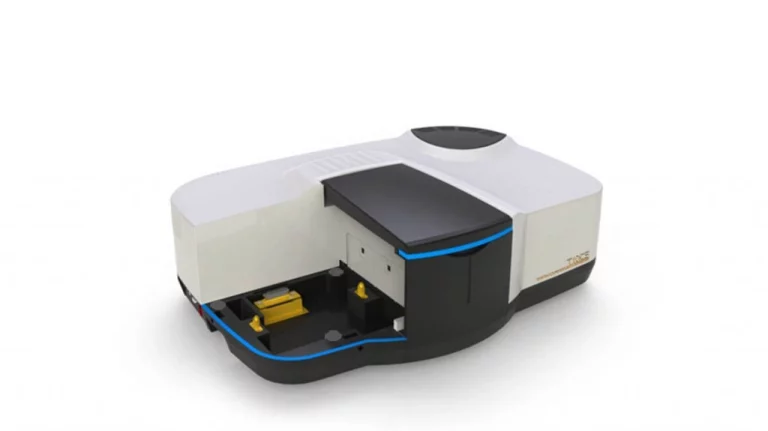
紫外−可視分光光度計は化学的及び生化学的検査に広く応用されている。核酸、タンパク質、有機化合物の研究に役立ちます。また、水質を観察したり、汚染物を発見したりするなど、環境検査のポイントも担当しています。考えてみて T7D 紫外可視分光光度計DNA/タンパク質分析、定量検査、スペクトルスキャンに適した固体光度測定機能を提供しています。T 7は光度測定を処理することができ、スペクトルスキャン、定量測定、DNA/タンパク質分析を行うこともできる。強力な自動化レベルにより、迅速に実行できます。これにはほとんど手を出す必要はありません。これらの品質は、正確な作業とスムーズなプロセスを必要とするラボに最適です。
蛍光分光光度計の主な特徴
多くの原子や分子型は蛍光を発する。言い換えれば、それらは紫外可視スペクトルからエネルギーを吸収する。そして、それらは急速にエネルギーの大部分を放出します。残りのエネルギーは周囲の媒体で熱エネルギーや振動エネルギーに変換されます。発せられた光の波長は励起源の波より長い。専門家たちはストークスシフトと呼んでいるが、これは蛍光斑点の背後にある核心思想である。蛍光検査では、吸収された光ではなく、放出された光を検査します。そのため、従来の吸光度方法に比べて、より良い感度を提供しています。この品質は、痕跡を探すのに特に適しています。ここで、分析物の含有量は非常に低い。
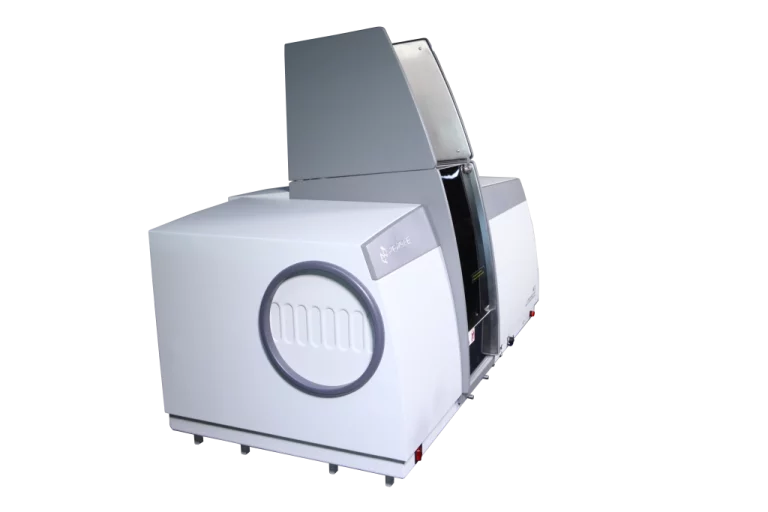
蛍光分光光度計の応用
蛍光ツールは生命科学に広く応用されており、生体分子の結合と細胞の検査に役立つ、内部動作。これらのデバイスは、ナノモル量でも動作する核酸またはタンパク質の迅速なカウントを可能にする。1つは、その特殊な蛍光パターンによって蛍光化合物を識別することである。場合によっては、蛍光色素または蛍光団によって非蛍光物質が標識され、蛍光ギアに非蛍光物質が現れることがあります。また、これらの設定は医学診断と薬物研究に役立ちます。正確なテストを可能にします。例としては、酵素動力学または薬物結合検査が挙げられる。これらはすべて良好な光学的鮮明度に依存する。
紫外可視分光光度計と蛍光分光光度計の比較
蛍光分光光度法はより高い感度を有する。暗い設定の下で放出された光子を選択します。これは吸収設定を通過する光を測定するのとは異なります。それでも、測定限界はサンプルの種類、設備の設定、光学計画によって変化します。分光光度計は可視光(白色光)または紫外光を処理することができる。それらの波長は約190ナノメートルである。スペクトルのこの範囲は、分析プロセスにおいて互いに対抗することなく、この2つの方法を有益な同盟国にする。
サンプル要件と製造方法
UV−Vis装置は通常、溶液が澄みきって濁りがないことを意味する簡単なサンプル調製を必要とする。一方、蛍光は通常、測定可能な発光信号を励起するために染料またはラベルを固定する必要がある。例えば、小さな有機分子や無機イオンなどの非蛍光化合物を検査する場合、蛍光標識を添加することが重要である可能性がある。そうしてこそ、測定がスムーズに進むことができる。
紫外可視分光光度計と蛍光分光光度計の間で選択する際に考慮すべき要素
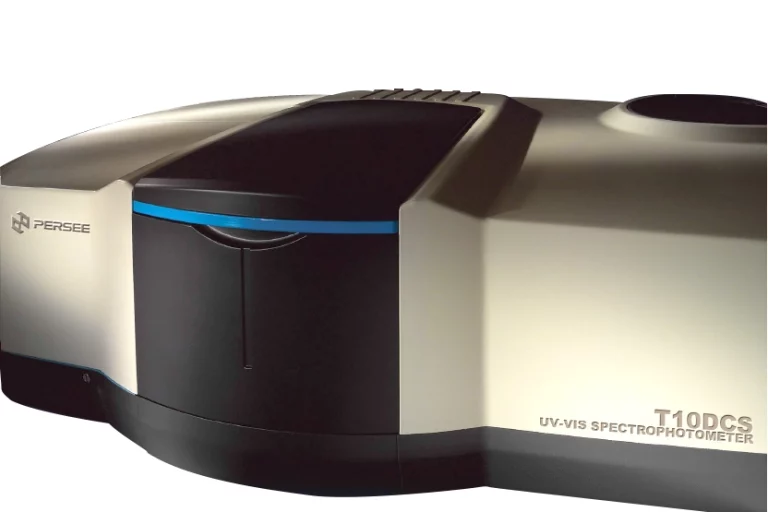
この2つのデバイス間の選択は、主に分析ターゲットに依存します。UV−Visは直接吸光度による定量濃度の測定において優れている。蛍光は、被覆分子結合または微量斑点の定性的外観においてよりよく現れる。日常的な品質監督に取り組むラボは、頑丈なUV-Visタイプに傾く可能性があります。例: TU500 UV-vis対照的に、生体分子の運動を研究する研究点は蛍光装置から多くの利益を得ている。これらは非常に微弱な信号を捉えることができる。
予算とコスト効果
紫外−可視分光光度計は、多くの場合、初期コストが低く、メンテナンスニーズも少ない。これは彼らの基本的な光学原理に由来する。蛍光システムの購入価格が高い。しかし、必要な場所に比類のない感度を提供します。これは、試料の量が緊張したままであるか、奇妙な試薬が混合物に入っている場合に有用であることが証明された。分光光度計は詳細な実験室ツールである。多くの科学分野に適しています。したがって、予算設定は、現在の分析要件と将来の円滑な運用に一致する必要があります。

メーカーとしてのPERSEEの概要
1991年に始まり、 忍耐 すでに中国トップクラスの分析ツールメーカーの1つに発展している。研究開発、生産、グローバルな伝播ラインを融合しています。同社はISO 9001品質認証を取得し、ISO 14001環境管理バッジを持っている。これらにより、製品セットへの安定した信頼性が確保されます。有限会社ユニバーサルインスツルメンツ有限会社は1991年に設立されたハイテク企業です。科学機器の開発、製造、販売を中心にしています。チームの30%以上が直接研究に従事しています。これらは、2ビーム設計調整や自動較正システムなどの光学技術の発展を促進することを目的としている。
PERSEEの観点は、社会公益に関する新しい考え方を強調している。それが言うように、「科学技術は個人が駆動し、社会に幸福をもたらすことを目的としている」。そのツールは、分子分光計からクロマトグラフィーシステムまで、世界的に認められている。さまざまな分野での工夫と持久力によって異彩を放っています。これらには、医薬品、食品安全検査、石化、教育、環境保護が含まれます。
プロダクトシリーズ
同社の製品ラインは、教育実験室に適した基本モデルから規則に基づくテストに適したハイエンド2ビーム計画までのすべての内容をカバーしている。突出したモデルには、T 7 D/T 7 DSシリーズが含まれています。これらはホログラフィック格子を用いて迷光を低減する。同時に、高速スキャン能力を維持します。これ T8DCS 0.1〜5 nmの調整可能な帯域幅を提供する。T 9 DCSは非常に低い迷光(220 nmで≦0.00004%のT NaI)を示した。これらはすべて、現在のラボで設定されている厳格な分析基準を達成することを目的としています。
結論
紫外−可視分光光度計と蛍光分光光度計は分析科学において独立しているがマッチングする役割を果たしている。UV-VisはBeer-Lambertの理念に基づく通常のカウント作業に容易さと強靭さをもたらした。蛍光は厄介な生物プローブまたは微量発見作業に最高感度の鍵を提供する。最適な選択は実験室の目標に依存する。これらは注意力、正確性、分子の詳細を強調する可能性があります。仕事の予算も役割を果たした。
FAQについて
Q 1:紫外可視分光光度計と蛍光分光光度計の主な違いは何ですか?
A 1:UV−Visはビル−ランベルトの法則原理に基づいて透過光から直接吸光度を測定する、蛍光はStokes変位現象に基づいて特定の波長で励起された発光光を検出する。
Q 2:1つの計器を別のものに置き換えることはできますか?
A 2:いいえ、それぞれの方法には異なる分析目的がある--UV-Visは定量濃度分析を得意とし、蛍光は蛍光分子に関する超感度検査を得意とする。
Q 3:どの分光光度計が私の実験室に適しているかどうやって判断しますか?
A 3:あなたの主な分析目標(定量と定性)を評価し、定期的に処理されるサンプルタイプを考慮し、保守コストを含む利用可能な予算配分を審査し、選択する前にこれらの要素を長期的な研究目標と一致させる。